If you’re new to this site, the most clinical explanation is: I’m an online entrepreneur who documents business experiments.
Can I double revenue on my website without adding new products? And can I do it by optimizing what’s already there using free online tools?
Let’s find out! Again.

Why?
I had a conversation with Andrew (my business partner) about doubling-down on product sales. I already 4x’d my income in digital product sales over last year so there’s momentum here!
If that’s the case, why improve this number even more?
Well, I recently connected a few dots from another person’s website business. And it turns out they were getting less traffic but making twice as much.
I said to Andrew, “I must be doing something wrong.” And I understand comparing myself to others could be a slippery slope. But this kind of stuff doesn’t make me jealous; it motivates me.
He thought I should focus on increasing sales to my existing products. He said, “you don’t have a product problem; you have a sales problem.”
What’s the Goal?
In this experiment, I’m only going to focus on increasing product sales. In the first version of this experiment, I tried to double both affiliate and product revenue. But since Amazon slashed my commissions this year, I have another experiment running focused just on affiliate marketing.
And since we’re in the middle of pool season, I’m going to focus on increasing sales in July 2020 over June’s numbers (which is a bigger month than July).
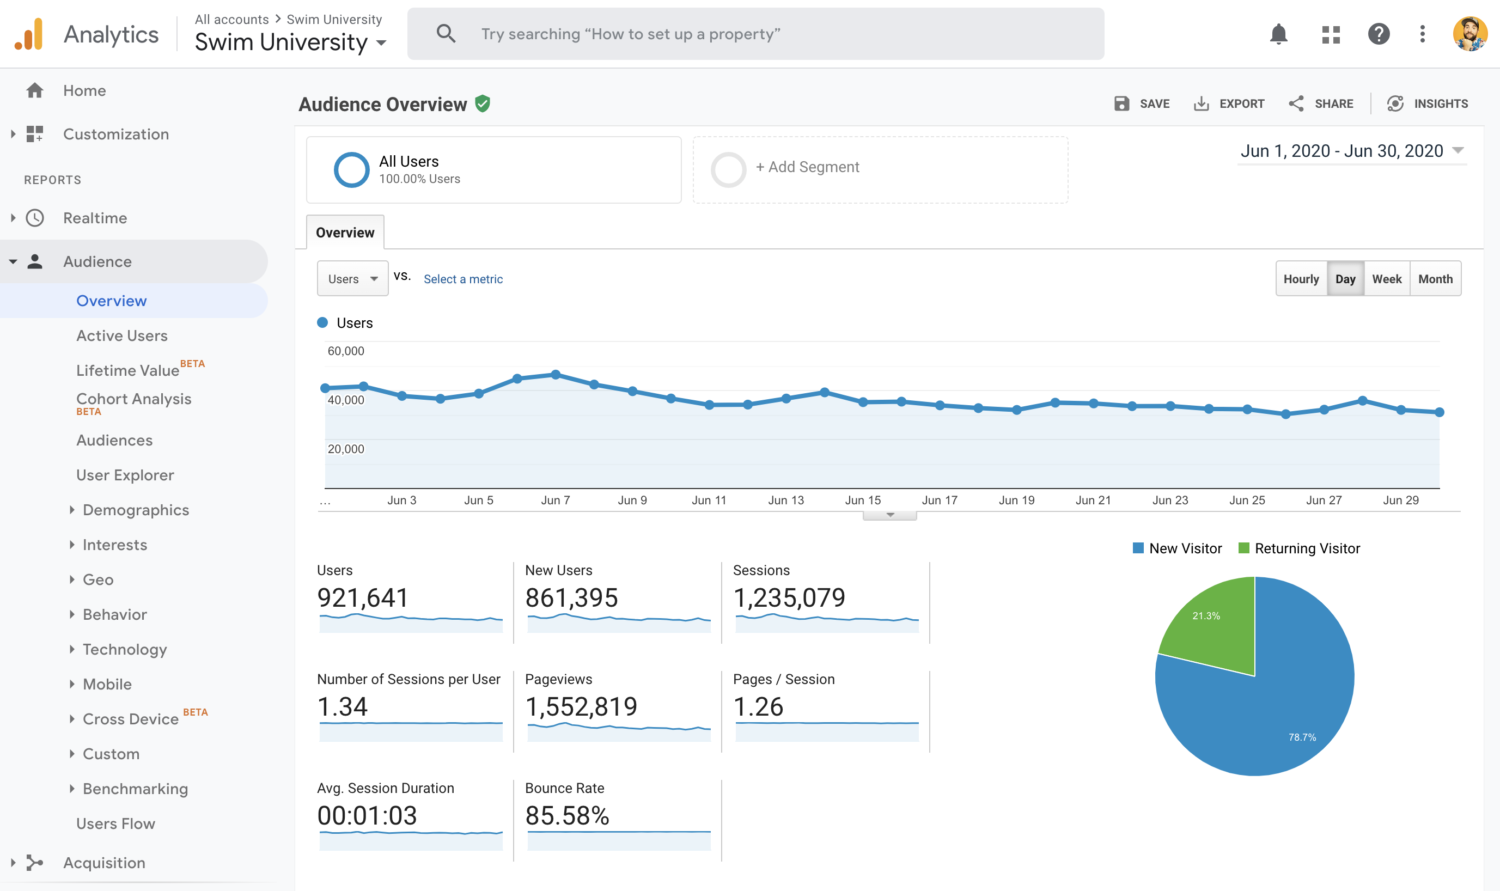
In June 2020, my website SwimUniversity.com made $44,268.50 in product sales.
I dramatically increased this over last year’s numbers ($10,106.90) by switching to Podia, publishing more videos, and adding more links to the sales page.
Everything you need to sell online courses, downloads, and memberships without worrying about the tech. This is what I use to host all my online courses.
I don’t have any actual proof, but I feel like Podia helped us avoid technical issues and made it easier for our older audience to buy products. That mixed with more general promotions all over our site led to more sales.
My goal is to increase that revenue again dramatically.
Context on How We Made That Money
- The site received 929,574 unique visitors via Google Analytics.
- There are two main digital products for sale (PDFs): The Pool Care Handbook ($49) and The Hot Tub Handbook ($49).
- There’s an upsell to the pool product called The Ultimate Money-Saving Guide for Pool Owners ($24).
- Each product is promoted on the site and through the email list (roughly 30,000 subscribers) to a sales page.
The Great Website Optimization 2020 Plan
My plan is to make big sweeping changes across the entire site. I’ll start with the top of the funnel and work my way down.
So this will be broken out in a multi-step experiment with each one having these core steps:
1. Gather Data and Set The Milestone(s)
I need to know a few things in order to know what and how to make improvements. First, I’ll start with improving clicks to the sales page from my website.
- What’s the total site pageviews broken down by page?
- Which pages get the most clickthrough rates to my sales page?
Next, I’ll improve the conversion rate of my sales page.
- What’s the total pageview count on my sales page?
- How many of those visitors convert to a sale?
I’ll set milestones by singling out the top-performing areas and making that the benchmark for improvement.
I’m going to use Google Analytics to its fullest with Google Data Studio to help me organize and display this information.
2. Create a List of Optimization Tasks
I want to start at the top and work my way down. I’ll improve two main areas of my site.
- Improve CTR From Articles to The Sales Page.
- Improve Conversions on The Sales Page.
I’ll do some very simple A/B testing with Google Optimize (another free tool from Google).
3. Measure The Results and Adapt
Once I initiate an optimization task, I’ll measure to make sure the goal was achieved. If not, the task will not be completed. I’ll try another experiment and measure again until the goal has been achieved.
This will continue for as long as I own the site. However, for this experiment, I’m going to improve things quickly and hope my actions pay off in the short term. That’ll at least know my grand experiment is working and worth it.
Gather Data and Set The Milestone(s)
The first thing I need to do is build a report to find the most visited pages based on pageviews. Then, how many of those visitors click through to the sales page via my product display boxes.
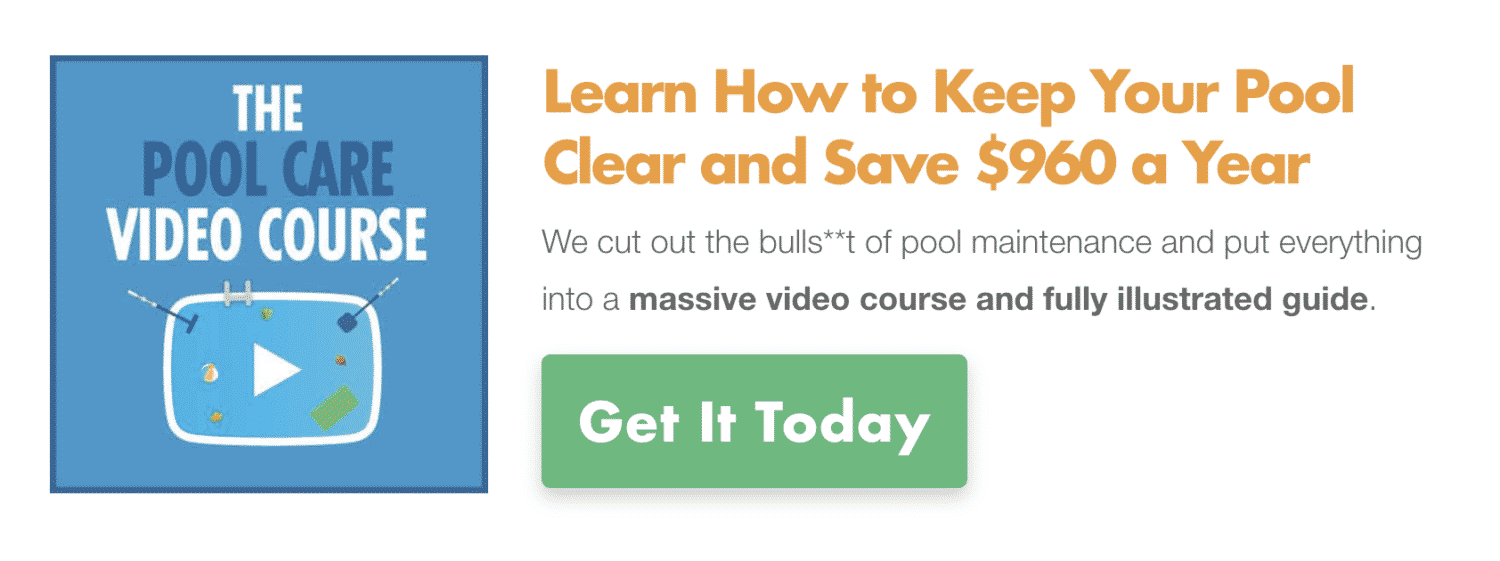
This is what the current version looks like:
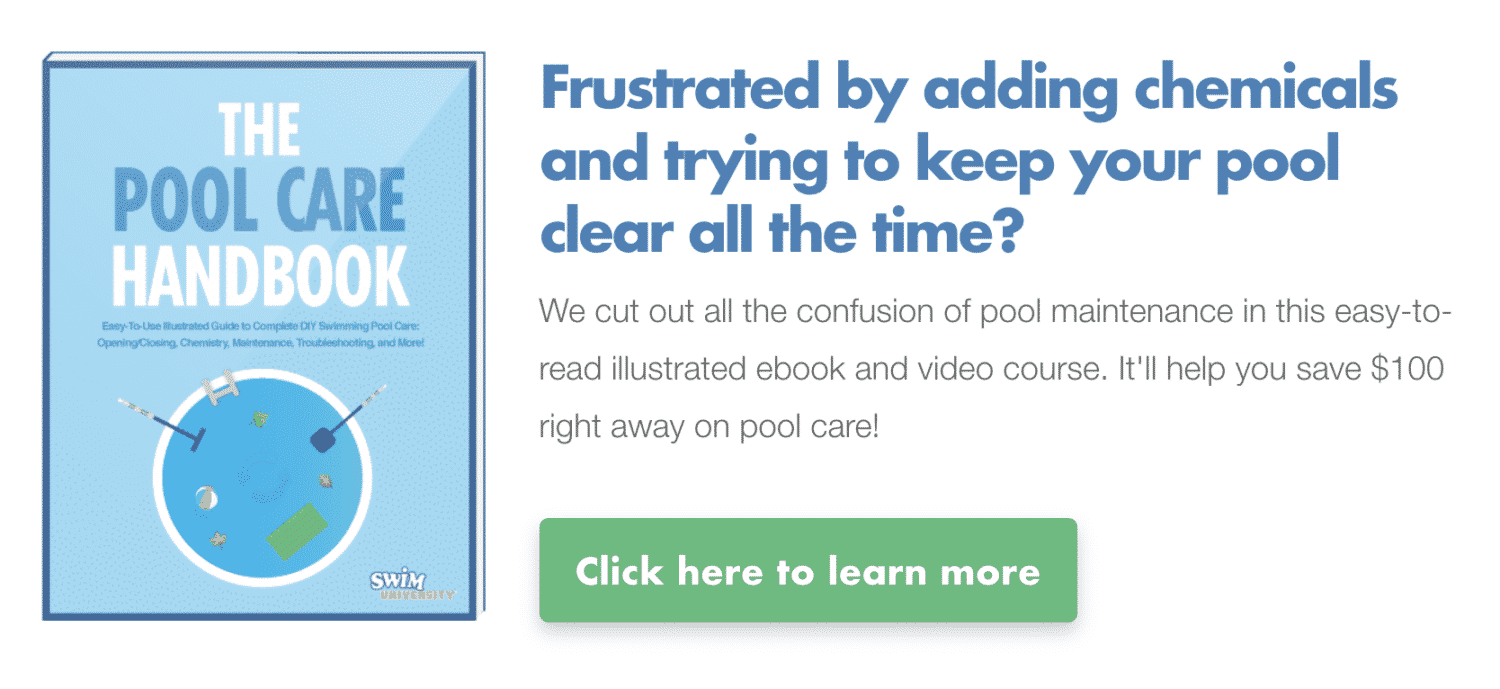
These boxes appear twice in a post: once in the middle (via shortcode) and once at the bottom (built into the theme).
I have event tracking set up to gather the number of clicks on these boxes. I also have UTM tracking to differentiate clicks between in-post and bottom-of-post displays.
Here’s the first step of building that report in Google Data Studio.
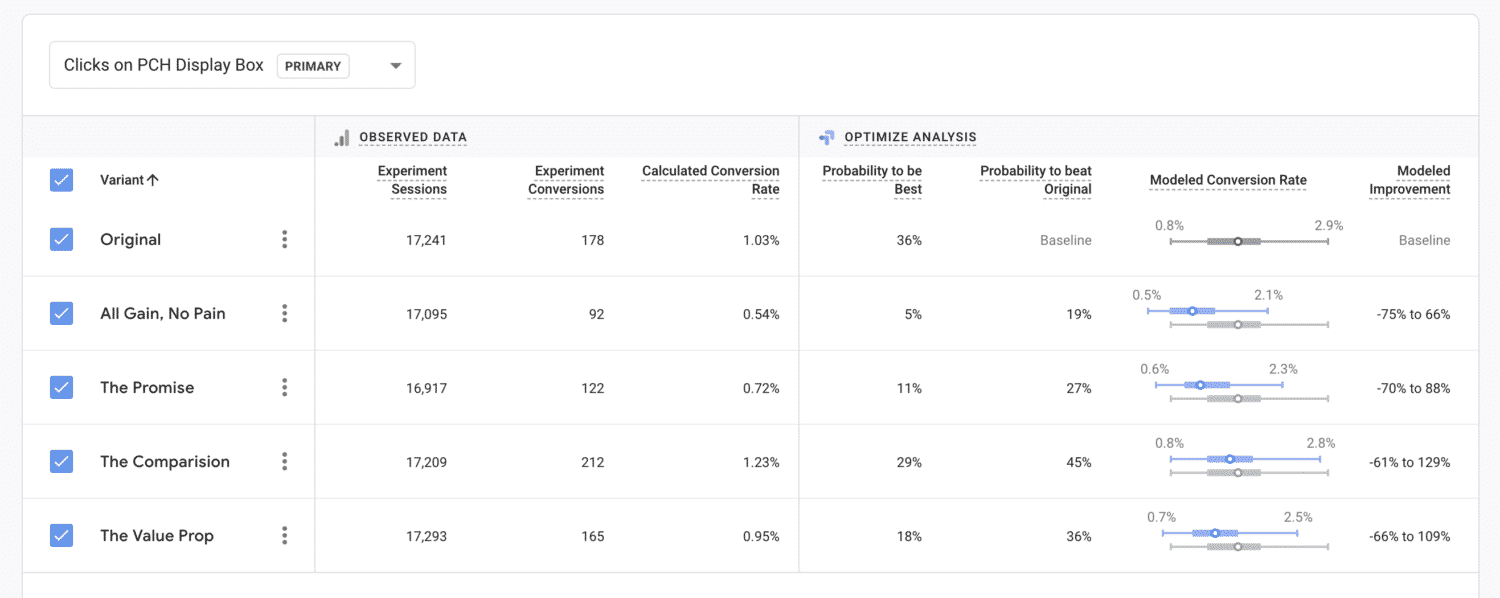
After figuring everything out like removing bullshit pages and averaging the conversion rate, I now have a table to measure the success of my first experiment.
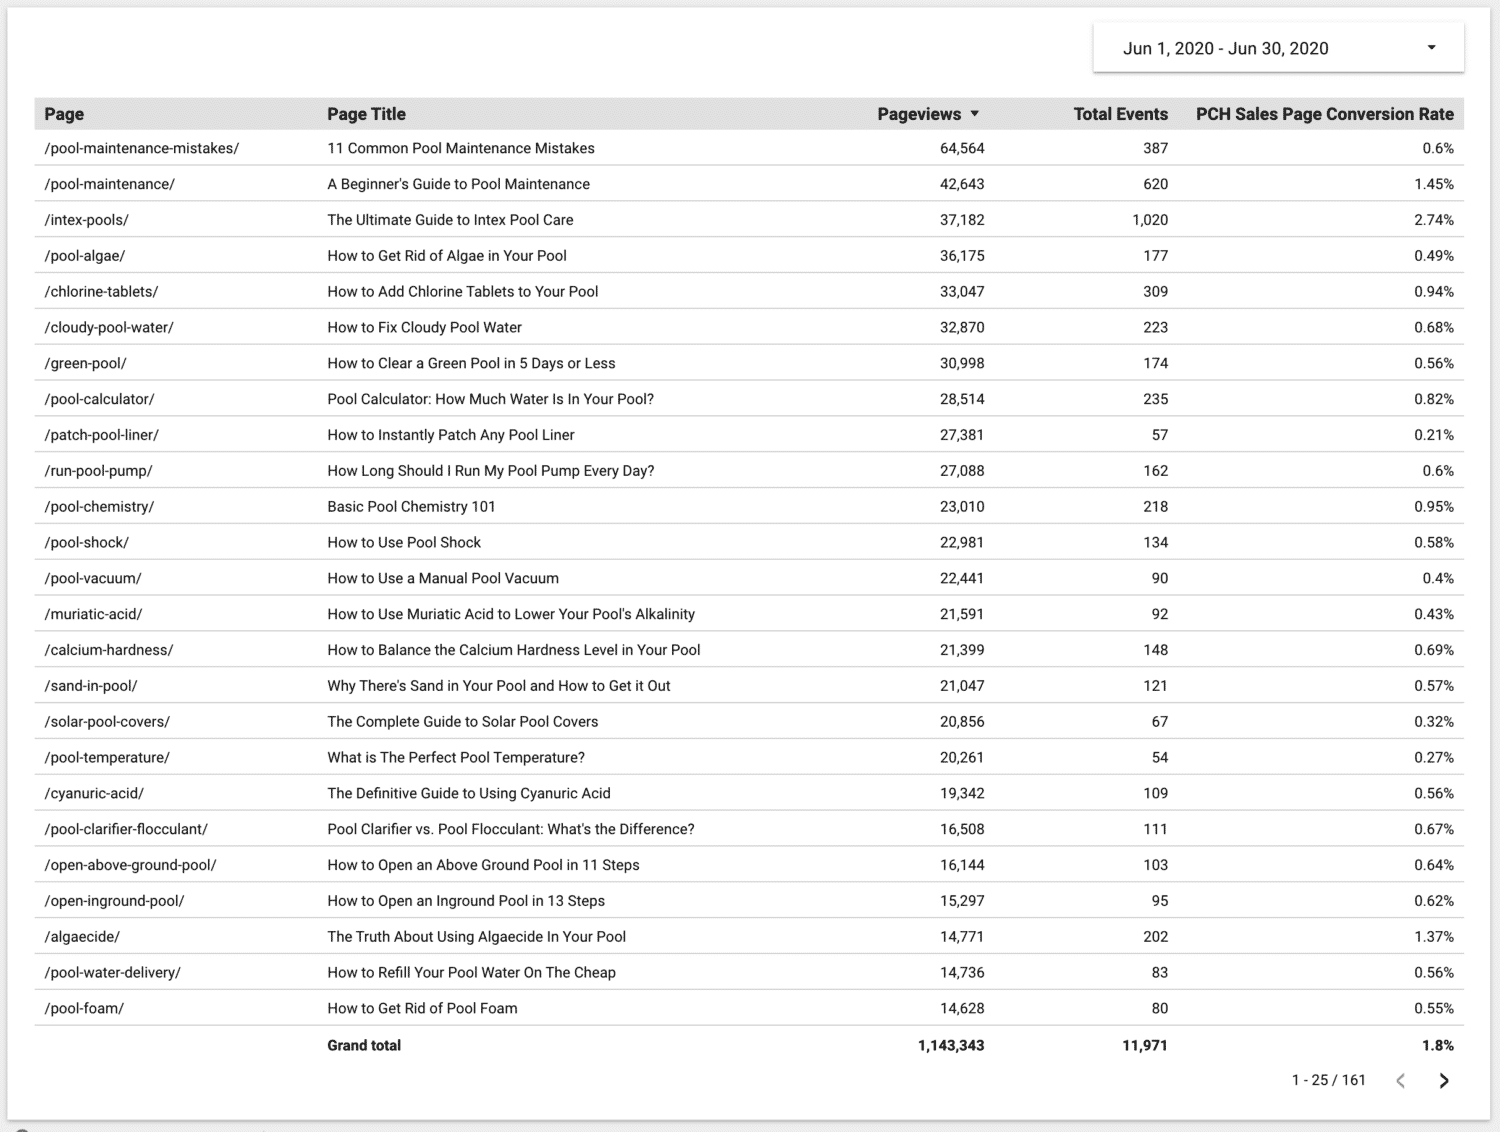
It might be hard to see, but the overall conversion rate to beat is 1.8% from June 2020. That’s a bullshit number since there are some posts with abnormally high conversion rates.
In July, it’s already 0.8% which I believe is the benchmark number to beat.
Improve CTR From Articles To Sales Page
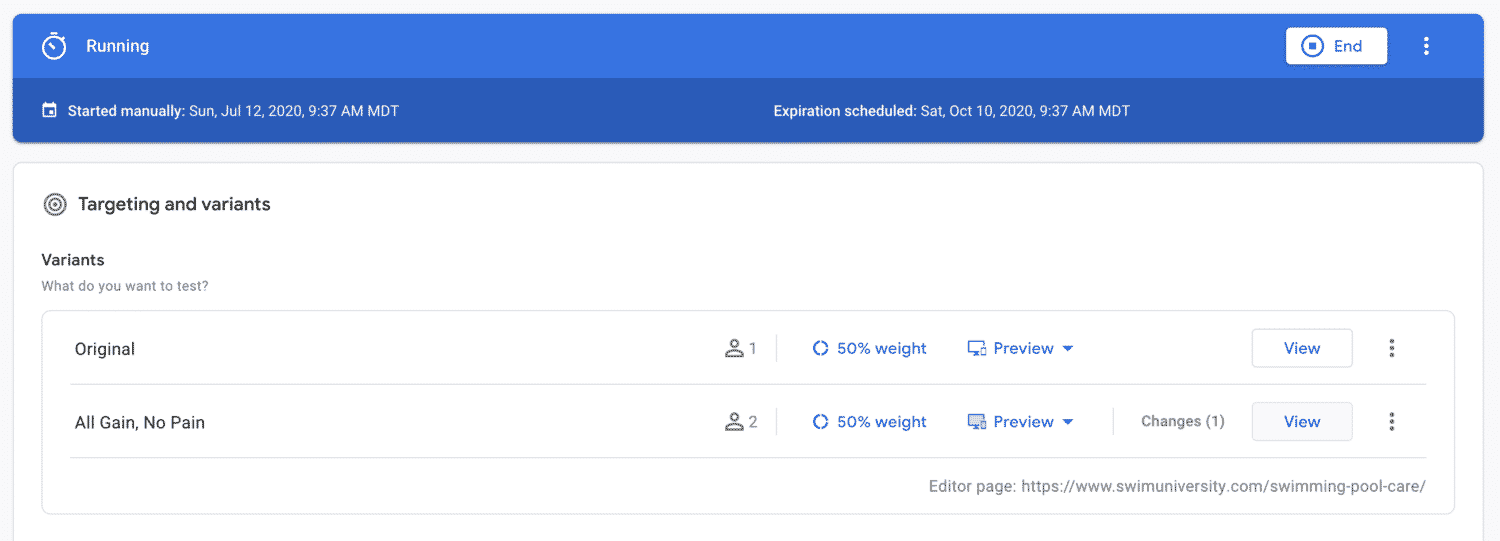
I’m using Google Optimize to test different versions of the display box across all pool-related pages on my site.
Sitewide Improvements To The Display Box
After running this test for a few days, it looks like the image of the video grid is favored to win. But now I think this test is stupid.
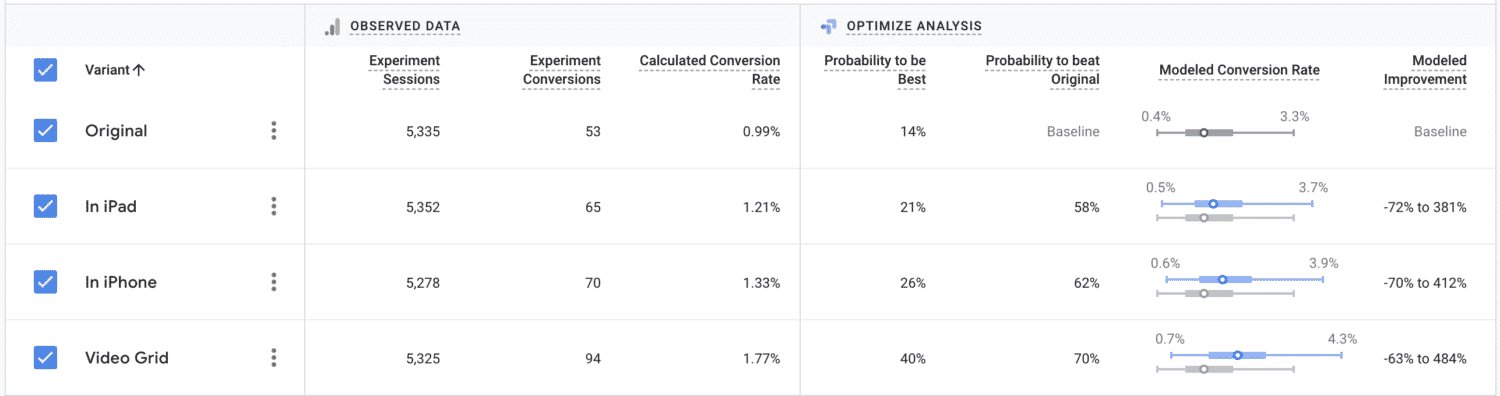
It’s not winning by a landslide. What if I do a bigger test by creating four completely different designs including layout, images, and copy? I think this would yield far more significant results that could lead to major improvements.
I also beefed up my Google Data Studio Report to see the big numbers I need to improve across the site.
The report above shows the current week I’m working on now. It looks like this week was better than the previous period already. This could be because of the shitty A/B test I’m running. The original image is performing at 0.99% while the image grid test is getting 1.75%.
Improving The Test For More Meaningful Results
I’ll create a combination of 4 different headlines, images, descriptions, and buttons. Once a winner is determined, then I’ll A/B test each element for the best combination.
- I’m going to try 5 headline formulas (including the original) courtesy of Unbounce.
- For the images, I like everything being constrained within the iPad. According to Google Analytics, 77.91% of our visitors are on a mobile device or tablet. But each image will include different elements inside.
- For descriptions, I’m just going to make very subtle changes to the original copy.
- And finally, for the buttons, I’ll keep the color the same and just change the text.
Trying Another Test: Keep It Simple Stupid
After 5 days and close to 100,000 tests run, nothing is coming back significant. This makes sense. Doing a multi-variant test takes time. And I don’t have time to dick around during pool season when my numbers are high.
I’ve been talking with Miles Beckler about running Facebook Ads. But he also talked about split testing. This was in the back of my mind when Andrew and I had our original discussion.
So here’s my new plan in the order of the tests:
- Split test the copy.
- Split test the image.
I’m testing a completely different headline that’s shorter than the original. Let’s run the test!
In his article, Miles says…
I like to see a minimum of 7 days on a single split test. This allows me to balance out the differences in traffic between the weekends and the weekdays. Honestly, I prefer two-week tests: 2 Saturdays, 2 Wednesdays, etc. I also like to see a total of 500 conversions or a minimum of 1,000 visits.
I’m gonna see what happens after I hit 1,000 visits, which for SwimU will happen in less than a day. Then, I’ll check after 500 conversions. If I don’t see anything significant, I’ll give it close to a week and see what happens…
5 Days Later And Another Drastic Improvement
After 86,000 visitors and 800 conversions, nothing came back significant. Actually, the original was converting 0.02% higher. That fucking blew.
There’s a mantra that keeps going through my head from Jay Abraham…“
“Test screams not whispers”
Instead of testing a basic headline against another basic headline, seriously make a better ad. This valuable discussion came after I threw my hands up in anger and asked Twitter for help.
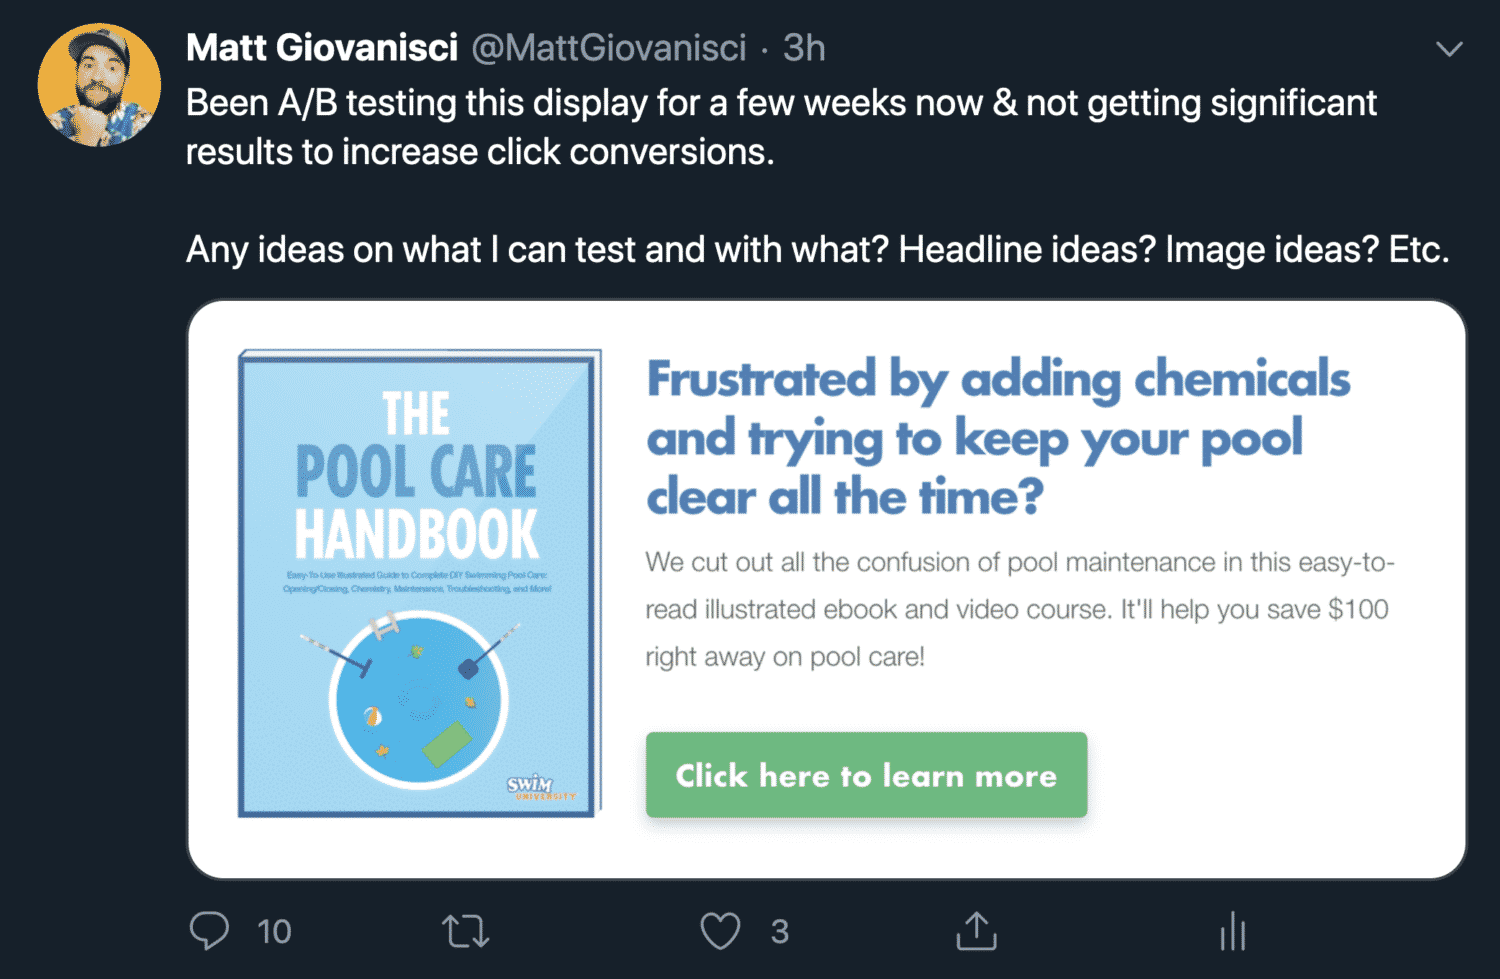
Of course, what really got the gears turning was a response by Miles. I mean, who better to get advice from on this topic?
He asked me 2 questions and gave two headline templates:
- Do the people you’re targeting want to stop using a local pool company?
- How much money or time would they save?
- How to _______ without ________ in __________
- How to _______ without ________ so you can save ________
First, I started by researching the cost of general pool maintenance so I can find a bigger savings number than just $100. I found this article that laid out EVERYTHING and started crafting new sales copy.
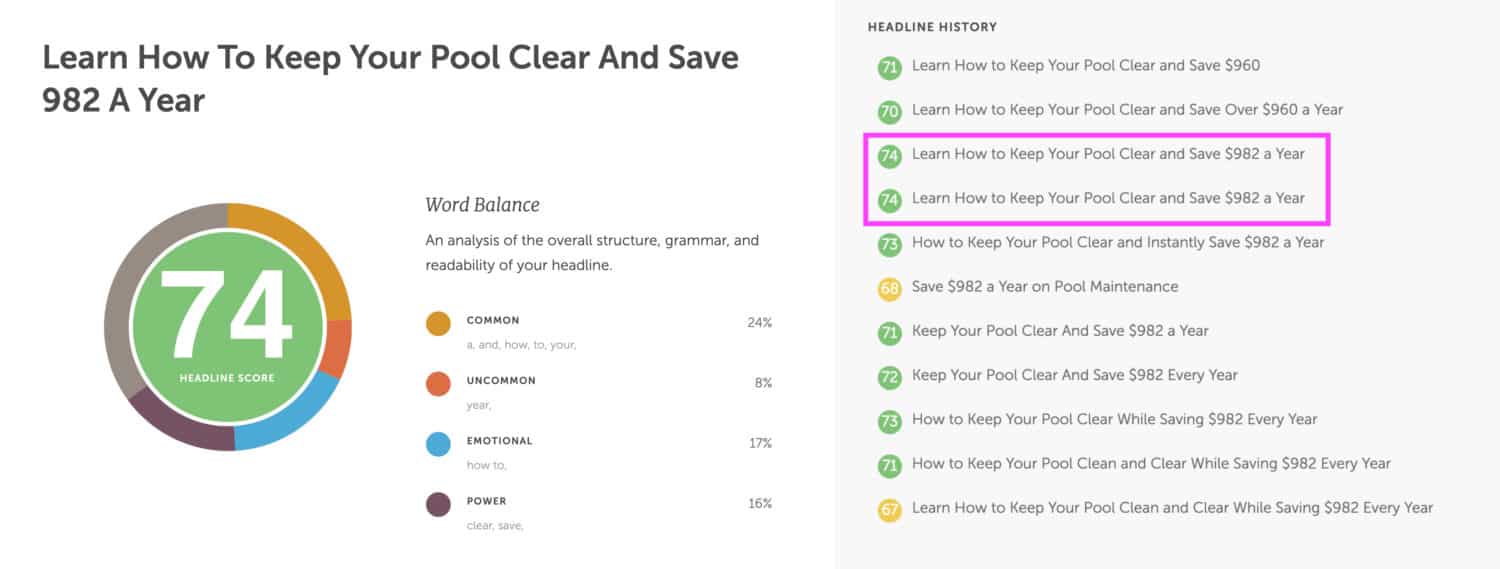
I ran a couple of headlines through the Headline Analyzer tool to find a good choice.
Then in Google Optimize, I crafted the new ad using HTML and a graphic I already had created when I launched the video part of my course.
Overall, this ad actually takes up less real estate than the original. I’m hoping it helps it to stand out more and get more clicks. Let’s see what happens…
Another 5 Days Later And…Goddamnit!
After 86,155 visitors and 815 conversions, nothing came back significant. Again, the original was converting 0.03% higher. Guess my original headline is doing pretty good. And I learned that saving money isn’t the pain point I thought it might be.
This led me to an idea. Instead of guessing what their pain point is, I asked them.
In early 2020, I emailed my list a general pool owner survey and got 1,422 responses. I asked six really easy questions.
- What type of pool do you own?
- How did you come to own your pool?
- How many years have you owned your pool?
- What main chemical do you use to sanitize your pool?
- What’s the BEST part about owning a pool?
- What’s the most frustrating part about owning a pool?
The last two questions are the most interesting. They’re open-ended responses, so I have a ton of content from actual pool owners that I’m going to use to build a new headline.
But first, I want more responses. So I’m going to send this to my list again and see what I get back.
Fast forward 24 hours and I increased the responses to 3,552. I think that’s plenty of data to work with.
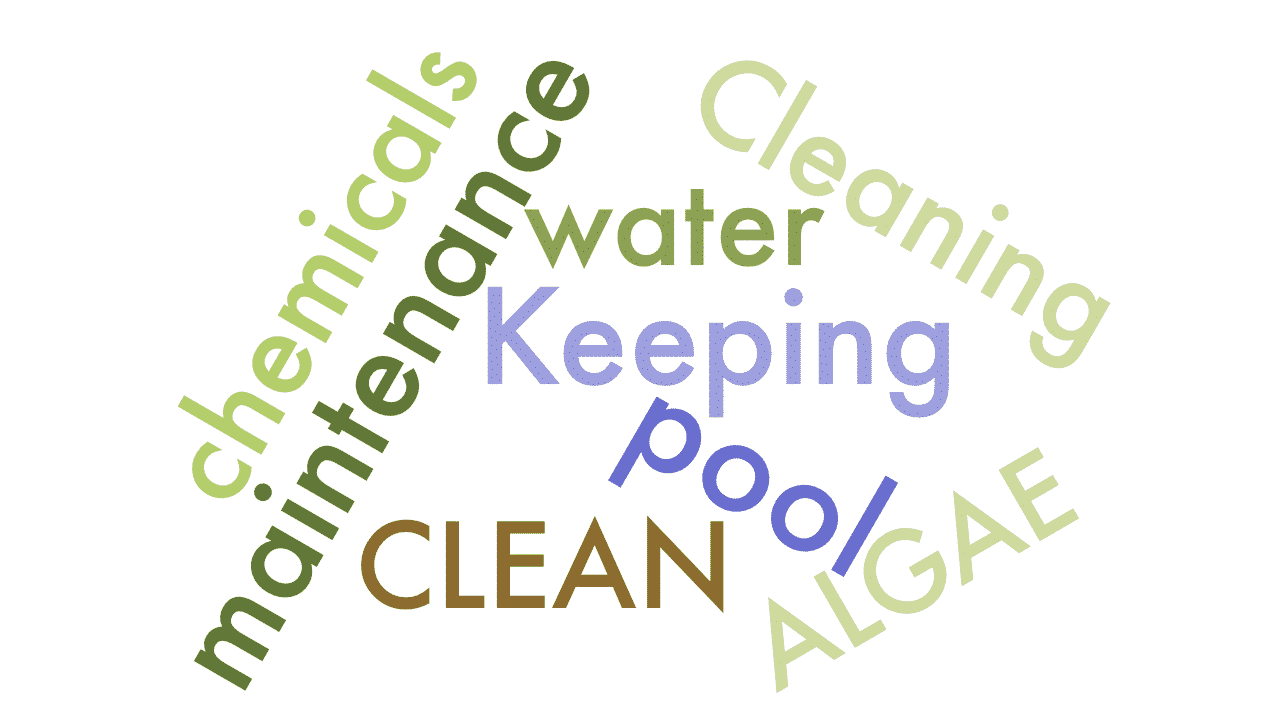
The Good Old Fashioned Word Cloud Idea
I’m going to take all the data, export it to a spreadsheet (because Google Forms is forcing me to), clean up the data by removing bullshit entries, and create a word cloud from it.
Instead of writing out the entire process, here’s a full video walkthrough of exactly how I did this. Plus, I included the resulting word clouds below.

New Headline Combinations with Real Words
Now that I have the top 10 words from real pool owners, I need to craft some headlines. As you’ll see in the video below, I wrestled with doing a multivariant test. I want to test a bunch of options. But I realized it’s better to try to beat the original with just one simple A/B test.
This video goes a little deeper into the rest of the experiment. I have plans to improve individual pages once I find a base. If you’re a conversion rate expert and see any issues with what I’m doing, please tweet or email me ASAP. I wanna get this right!
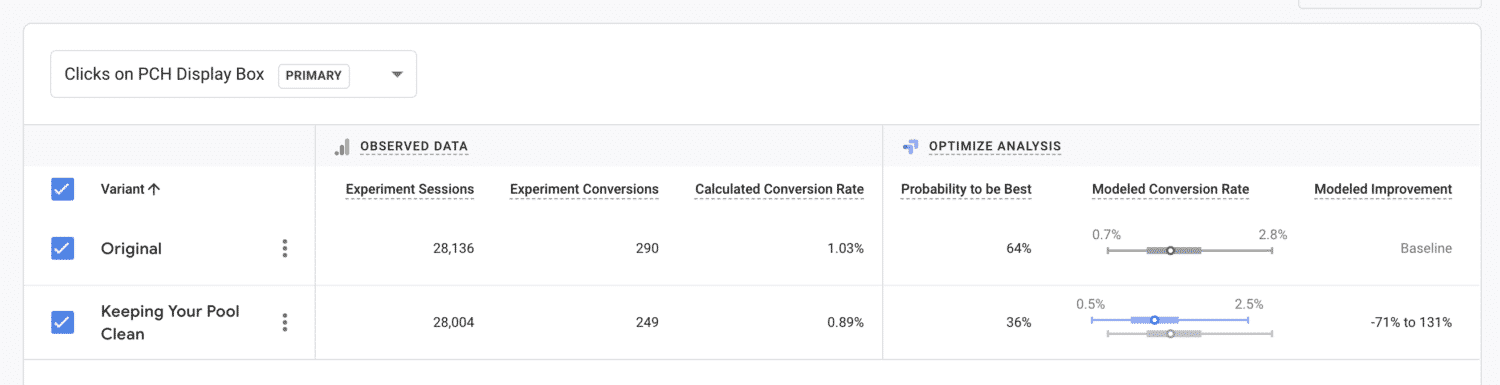
The WordCloud Test Didn’t Work
I’m starting to believe my original copy is pretty good. I know it can be improved, but nothing is really moving the needle. Here’s what the Word Cloud test showed.
I was getting pretty frustrated with A/B testing. Especially because it’s the peak season of traffic so I don’t have a lot of time to wait for test results. I want to learn fast.
Then, Nathan Hockley reached out to me with some insight I’d like to share.
Time periods need to be thrown out the window when it comes to split testing. It should be based on a volume of traffic you’re comfortable with. For certain tests we could reach statistical significance within hours due to the massive amounts of traffic we could throw at them.
When I was with Airbnb (before going full-time) we ran tests in hours because of the monumental amounts of traffic we had at our disposal. If we kept them running for two weeks we’d get to the same conclusion and be moving 10x slower.
18,000 tests is a solid amount for a single variant. If you keep it going for however long is left to hit two weeks, the confidence level might ±5%.
This put me at ease. Plus, he offered a new test I could try.
Since my original copy is doing pretty well, there’s no point splitting hairs trying to squeeze a little more juice from it. Instead, Nathan suggested I flip the design colors to A/B test a light mode/dark mode (like my subscribe box).
Hypothesis: Color change will stop the user in their tracks and make them pay more attention to the CTA, which will increase CTR.
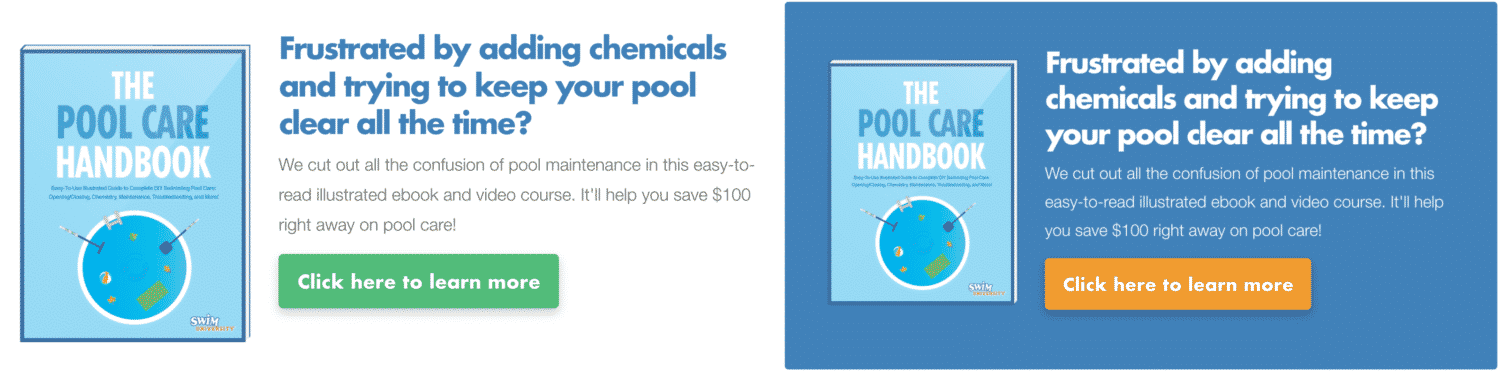
And after running this for about 9 days with close to 200,000 sessions and near 2,000 conversions, the dark mode variant performed better. But only by about 0.16%.
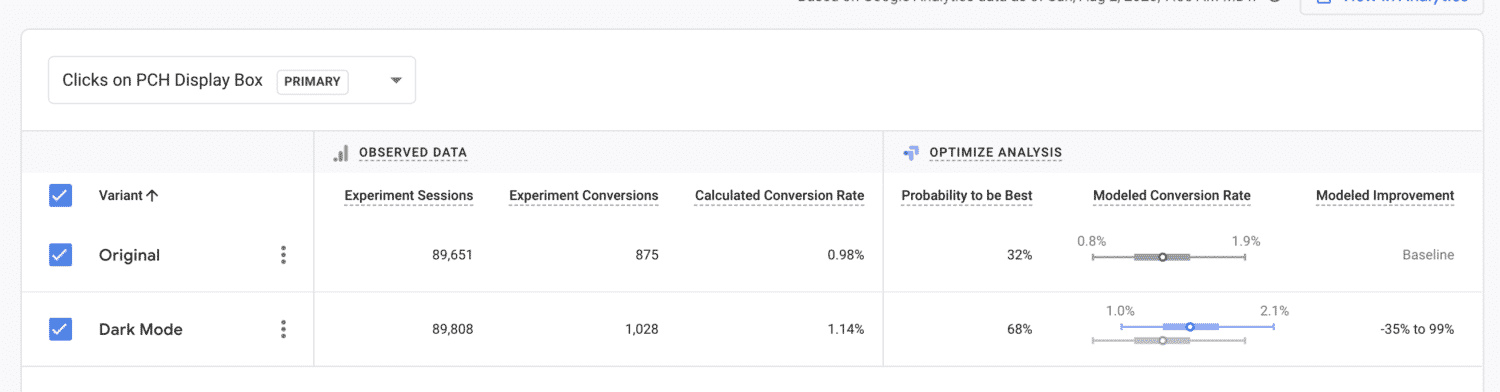
This means I’m officially switching to dark mode full time and I’m going to run some more small tests including:
- Multi-variant test on the image
- Background Colors
- Original Vs Simple Copy
- Button Color and Text
But for this experiment, we’re going to move on increasing sales page conversions.
Here’s a recap of what I plan to do going forward to continue improving this.
Lead-In Copy on Our Top Posts
Steph (my life partner) believes improving placement and lead-in copy will have a more meaningful impact on CTR than A/B testing headlines and images.
Now that my broad A/B testing is complete, I’m going to test this hypothesis on individual high-traffic pages.
I think being more granular in my messaging depending on what article you’re reading will work well.
Here’s an example of one of my top posts.
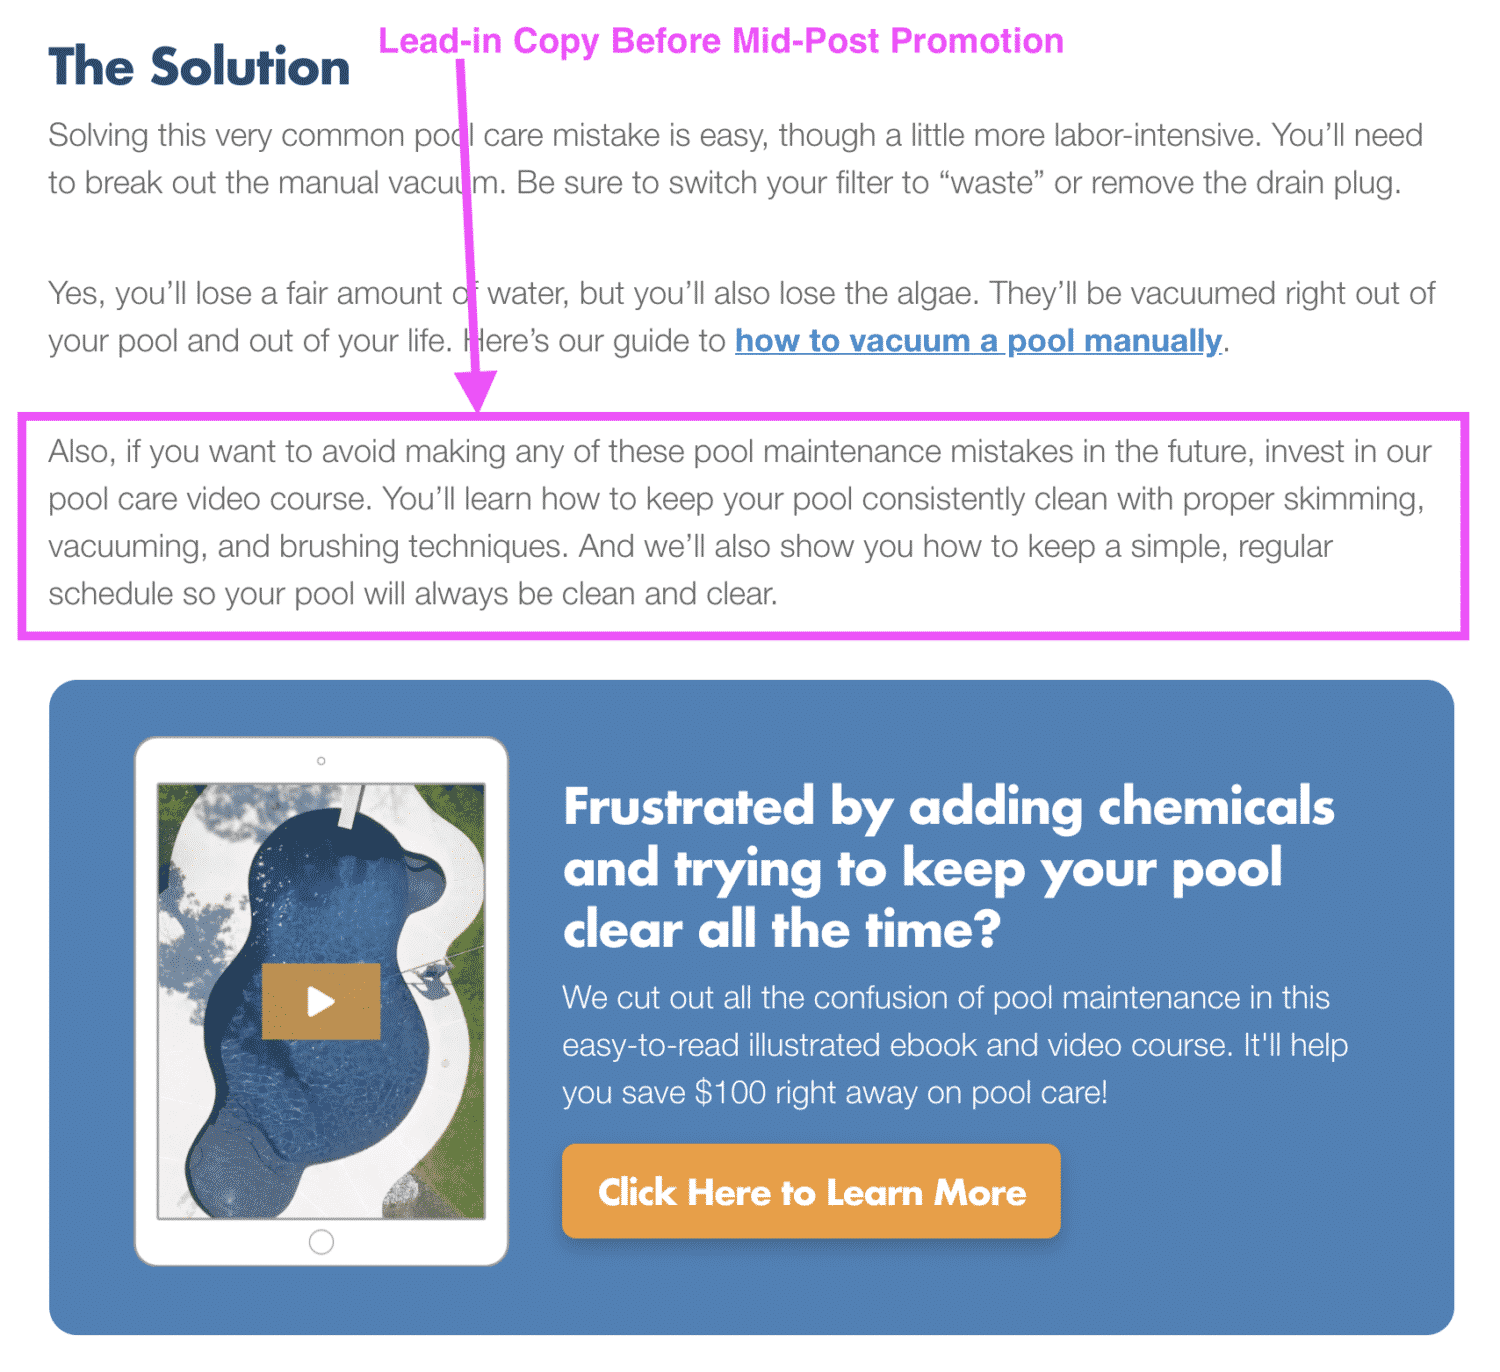
This actually worked! In the first seven days of August where I didn’t have lead-in copy, our CTR was 0.48%. But since then, we increased to a 0.92% CTR.
Not bad especially when you do this across all the top posts. This will really add up!
Improving The Site Design
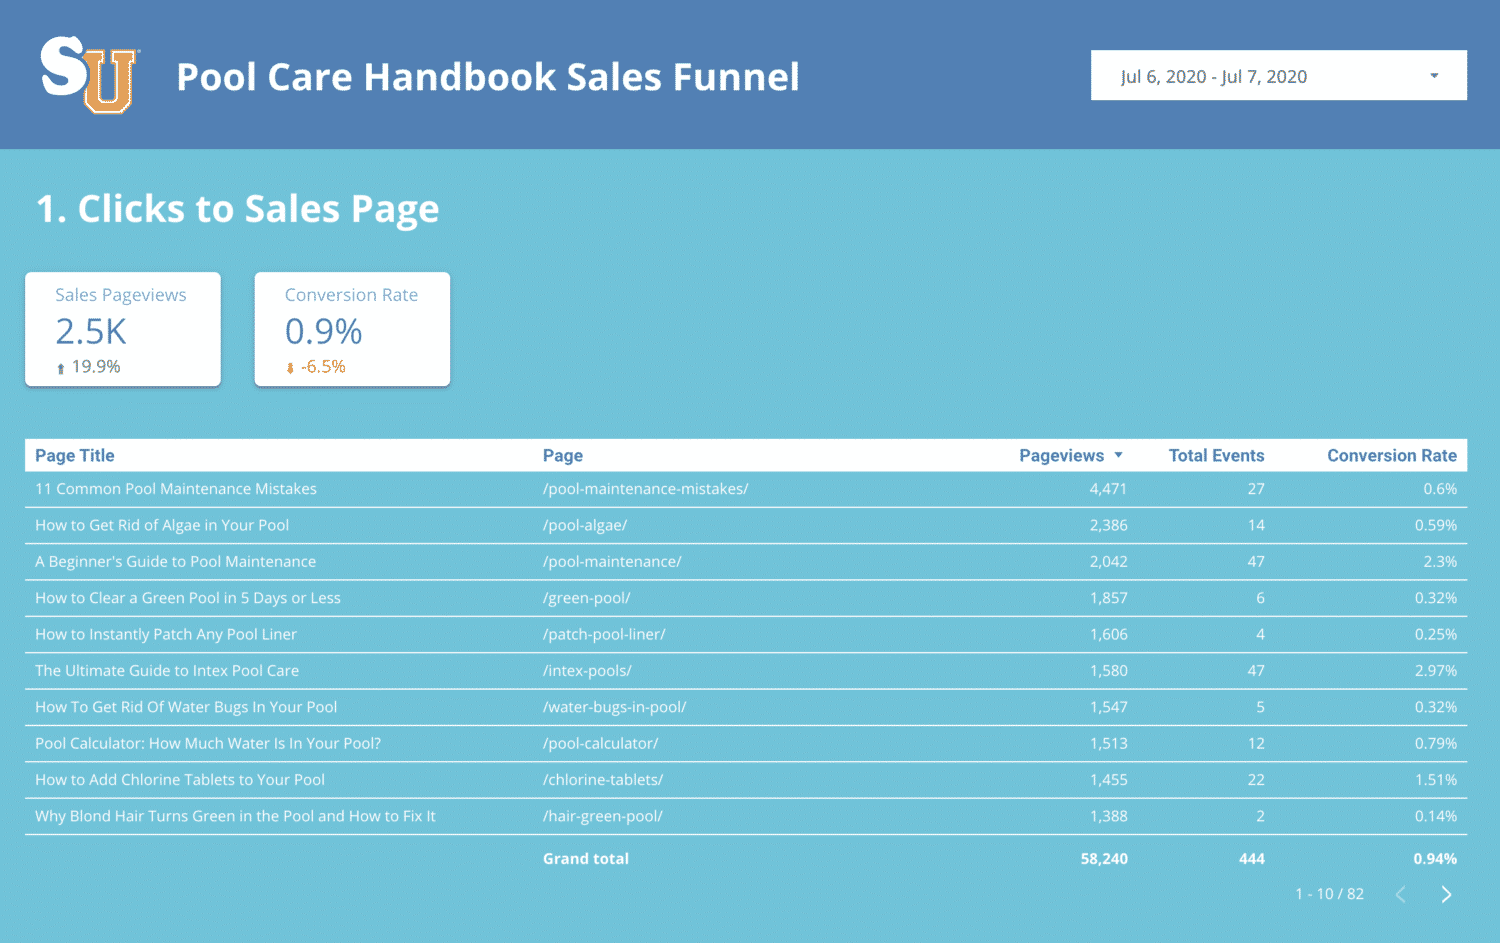
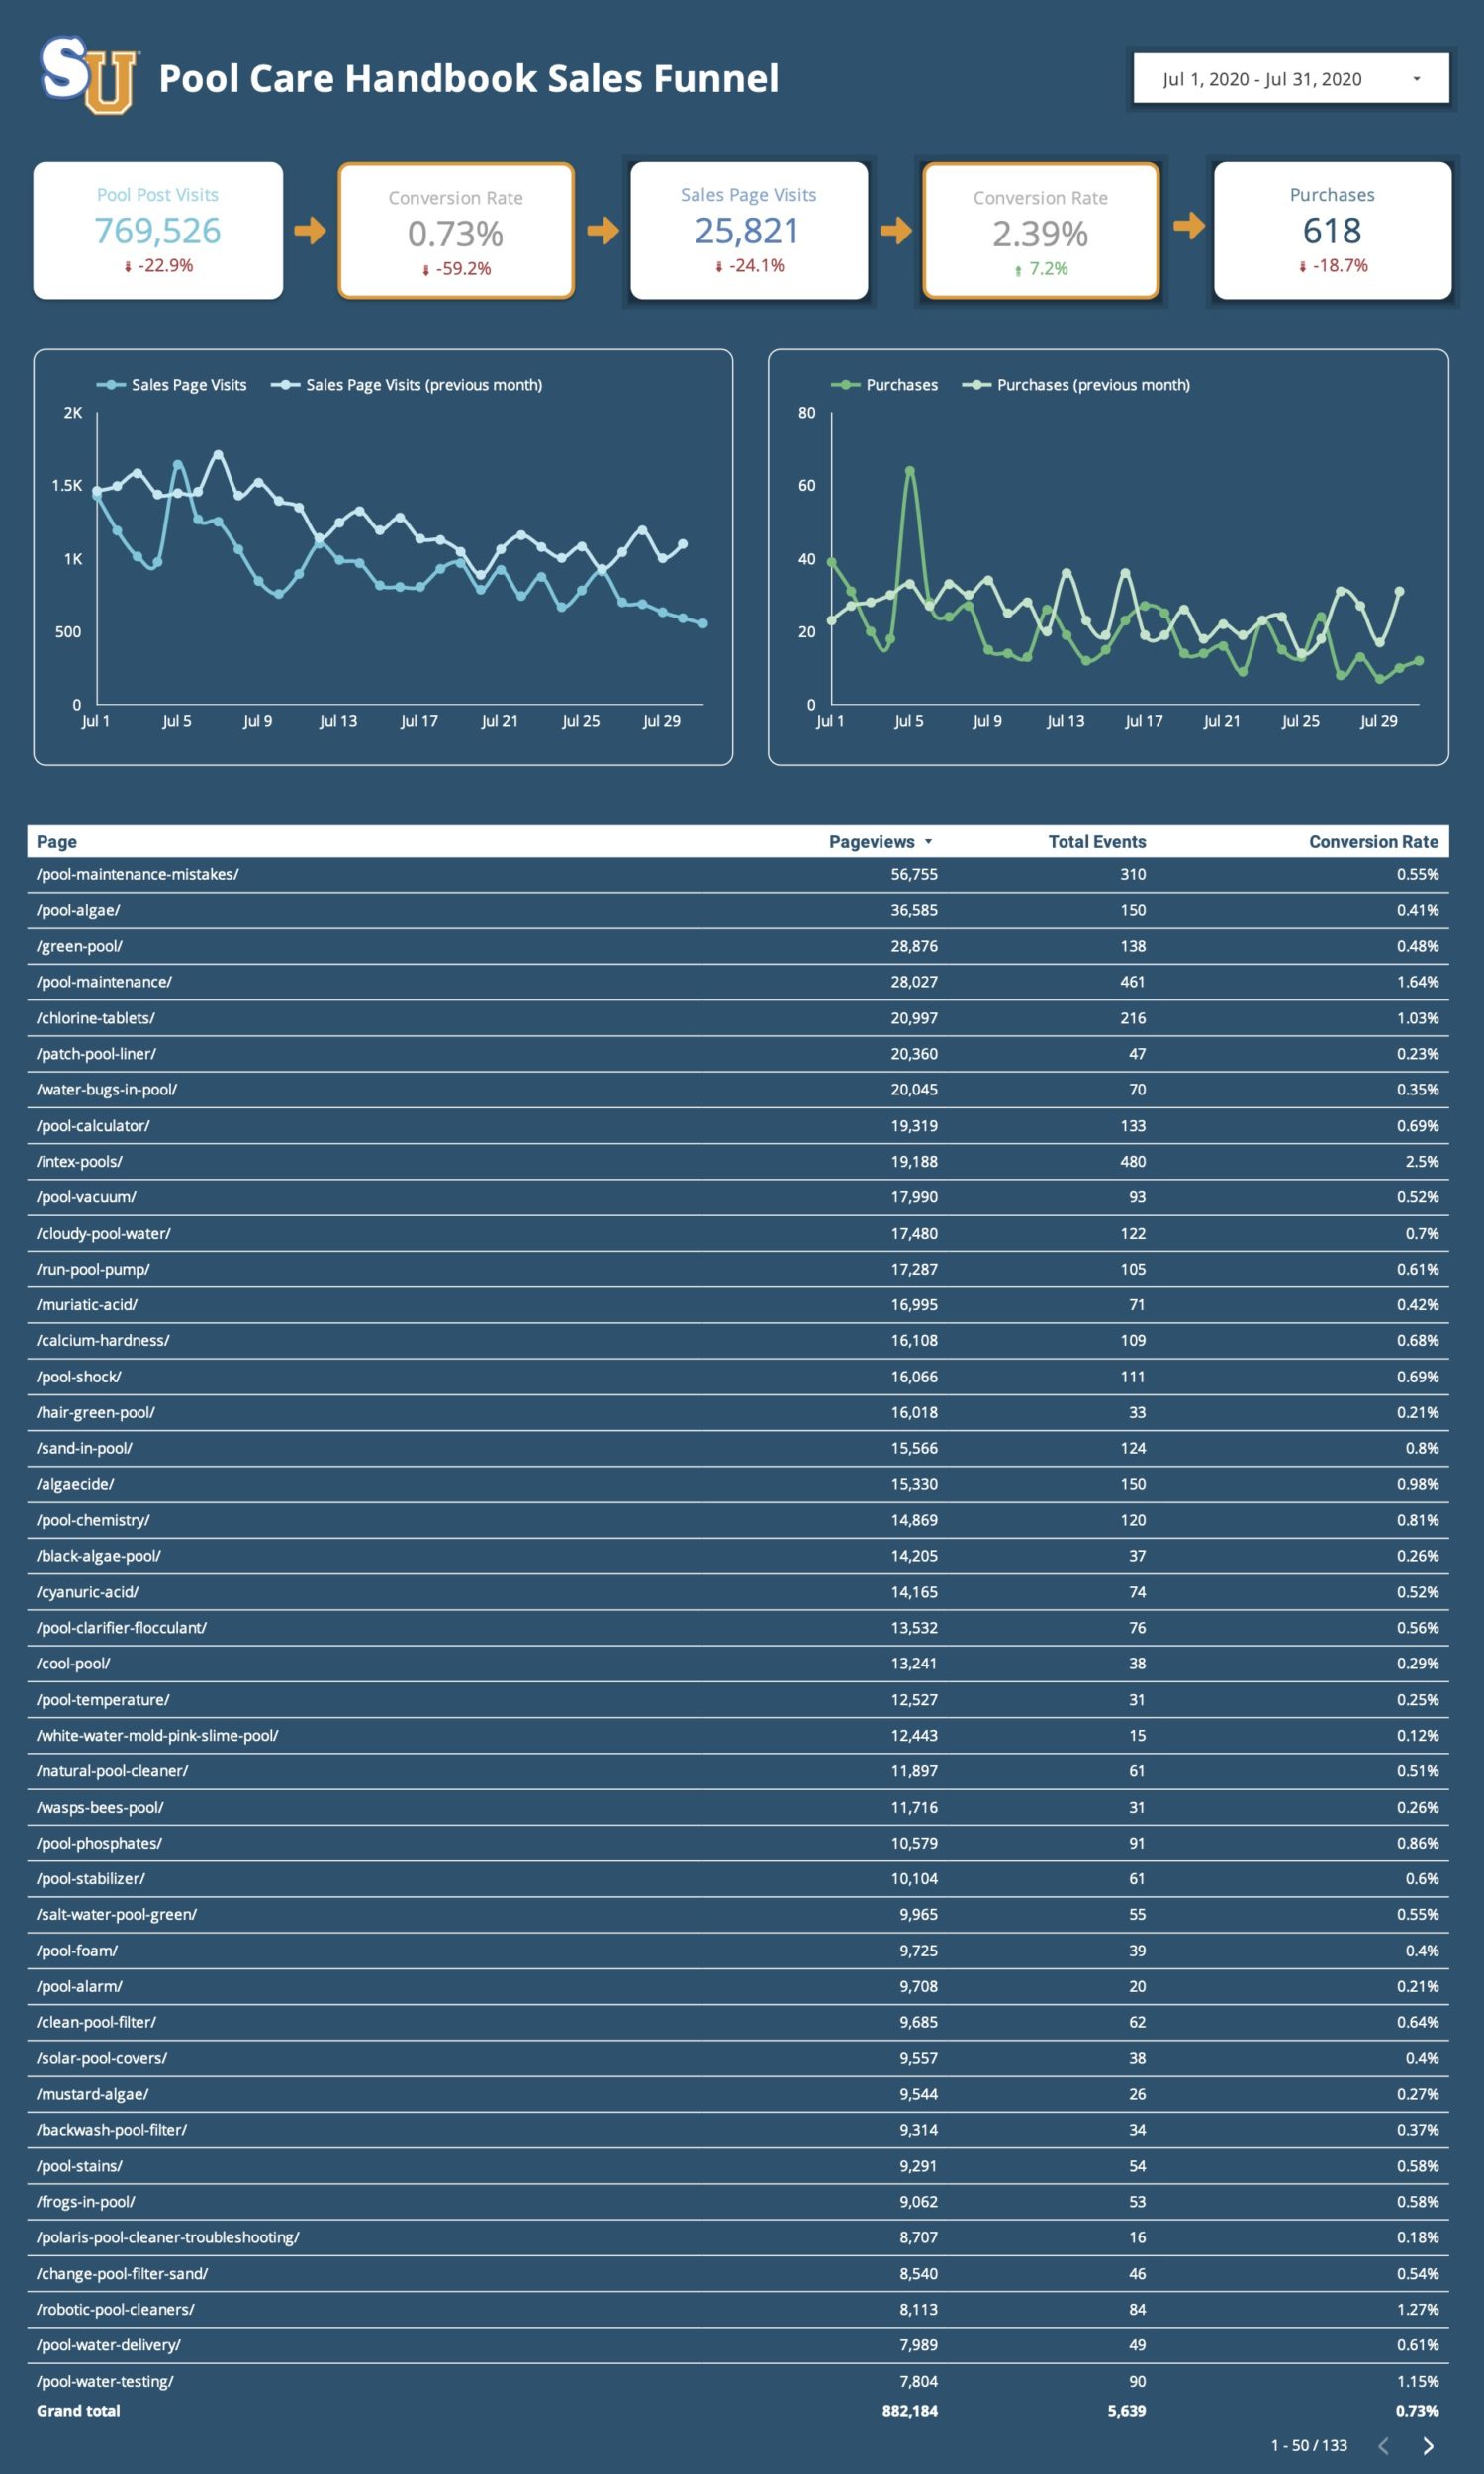
I redesigned my Google Data Studio report to include purchase conversion rates and totals. I created one massive report that includes the entire sales funnel for the Pool Care Handbook.
Here’s a screenshot of the report for July 2020. And below that, there’s a video breaking down how I created this report.
Changing The Site Design For Clearer Call-To-Action Areas
Before diving into changing the sales page copy, I got an email from someone who challenged me on my site’s design. He had a lot of feedback, but a few nuggets stood out to me.
You don’t have a dedicated CTA color. If your main site color is blue, orange is a good contrasting color according to the color wheel. But your non-clickable headings are also orange. And your clickable hyperlinks are blue. And don’t be scared to show a little video capture in the CTA.
This made me think about the entire design of my website. And I ended up making a lot of subtle but important changes including
- Making all articles headings the same color dark blue so they don’t feel like clickable links:
- Making all the buttons orange to contrast with the main brand color of pool blue.
- Adding built-in navigation to subcategories (more about this in the video below).
- Adding video images to the display boxes for my product.
What’s Next?
At this time, I’m not going to focus on drastically improving the sales page. I think the conversion rate is pretty good right now after the design changes and copy tightening I did.
What I’m more focused on now that Swim University feels pretty solid is creating more products. We’re currently working on a pool winterization course that I think will be a huge hit in September and really add to our bottom line.
Next year, I’ll focus on improving all the sales pages across the board.
I also just moved from ConvertKit to ActiveCampaign. So during the off-season, I’ll be focused on really dialing in our email marketing strategy. And of course, we’ll continue to produce new content weekly with a focus on SEO.
Did Digital Product Revenue Increase?
No. But I expected that. The main reason for this is seasonality. I started these experiments at the end of pool season. So revenue naturally goes down, but it didn’t fall drastically.
I was able to increase the conversion rates to and on my sales page for my pool maintenance course. This will probably earn me more money than I would have made if I did nothing.
And all this work will really pay off next pool season. So I’m excited for that!
Here’s What Worked
- Redesigning the CTA box for the products in posts to make it stand out.
- Writing lead-in copy before CTA boxes in posts.
- A/B testing images in the CTA box with video play buttons.
- Redesigning the website to make things more actionable to click.
What Didn’t Work
- Changing the CTA headline (apparently I had already nailed it).
- My impatience for split testing results.
What I Learned From This Experiment
How awesome, important, and frustrating split testing can be. I mean, I’m glad I learned how to do it right and I’ll continue to test everything going forward.
But it’s boring and I hate it.
Thank You
I need to thank Andrew Fiebert for giving me the idea for round two of this experiment.
- Miles Beckler for writing and teaching me about split testing.
- Nathan Hockley for making me feel better about my dismal split testing. He was super SUPER helpful in all this.
- Guido de Bruijn for writing the longest and most graphic email that inspired me to redesign Swim University.
Thanks to Steph, my beautiful and supportive girlfriend for helping and putting up with me during these experiments.
And finally, thanks to everyone who reads this! The fact that you’re reading this makes the painful slog of writing much easier.
Peach out 🍑