If you’re new to this site, the most clinical explanation is: I’m an online entrepreneur who documents business experiments. Boom, nailed it!
Can I double the revenue on my website without adding new products or services? And can I do it by optimizing what’s already in place only using free online tools?
Let’s find out.

What’s Already In Place?
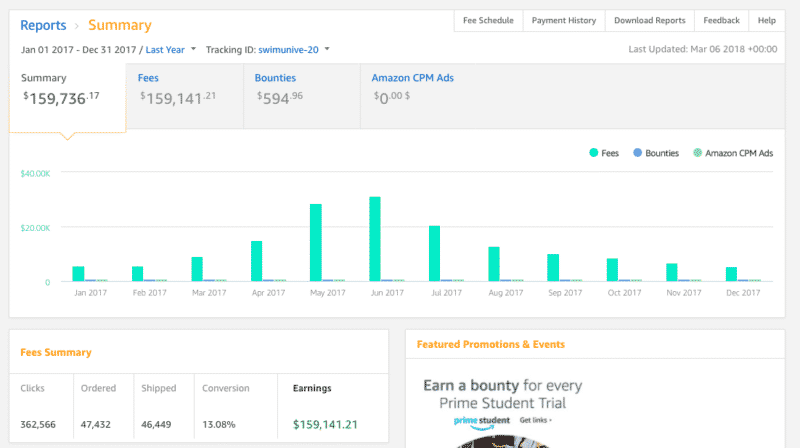
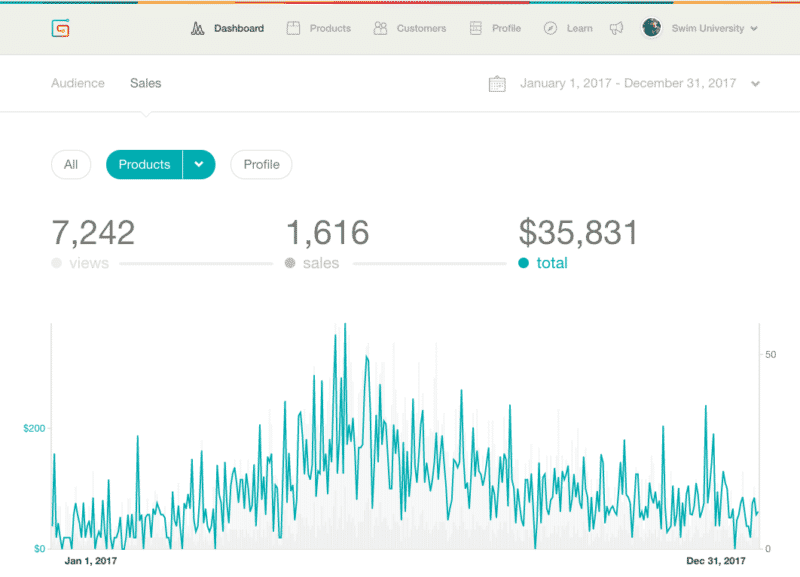
My website, SwimUniversity.com, made $159,736 in Amazon affiliate revenue and $35,831 in product revenue in 2017. That’s a total of $195,567!
My goal is to double that revenue in 2018.
Affiliate Revenue in 2017 Context
- The site received 5,544,985 sessions via Google Analytics.
- We only promote products on Amazon. In other words, there are no other affiliate programs used.
- 362,566 clicks were recorded in Amazon Associates with a 13.08% conversion rate.
- An average of $0.44 per click.
Digital Product Revenue in 2017 Context
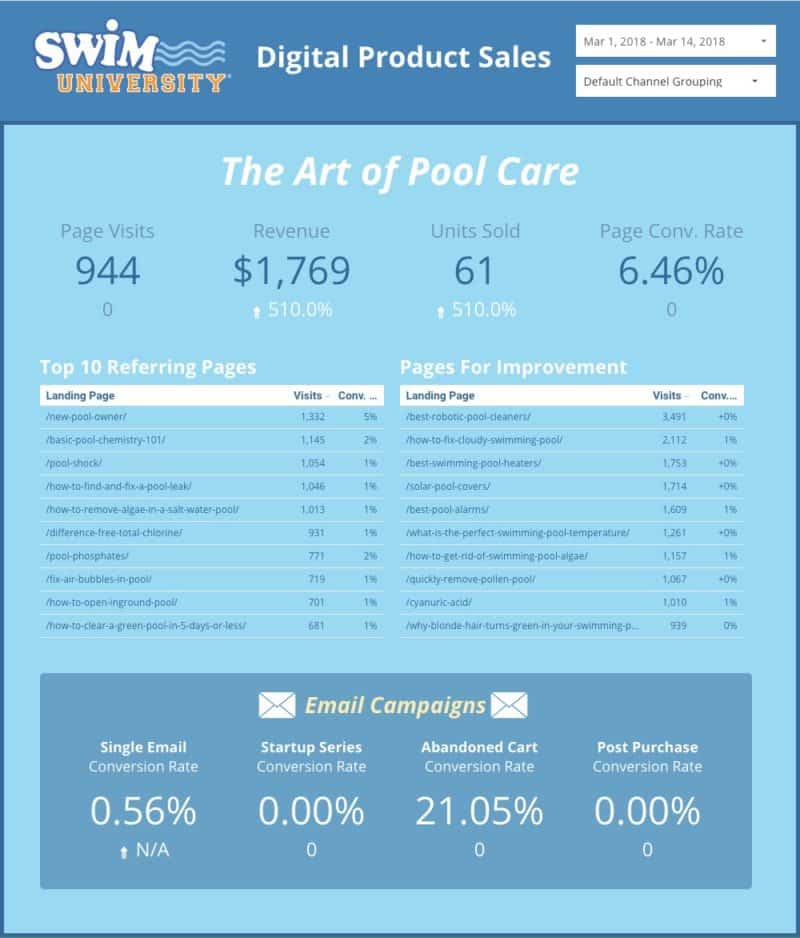
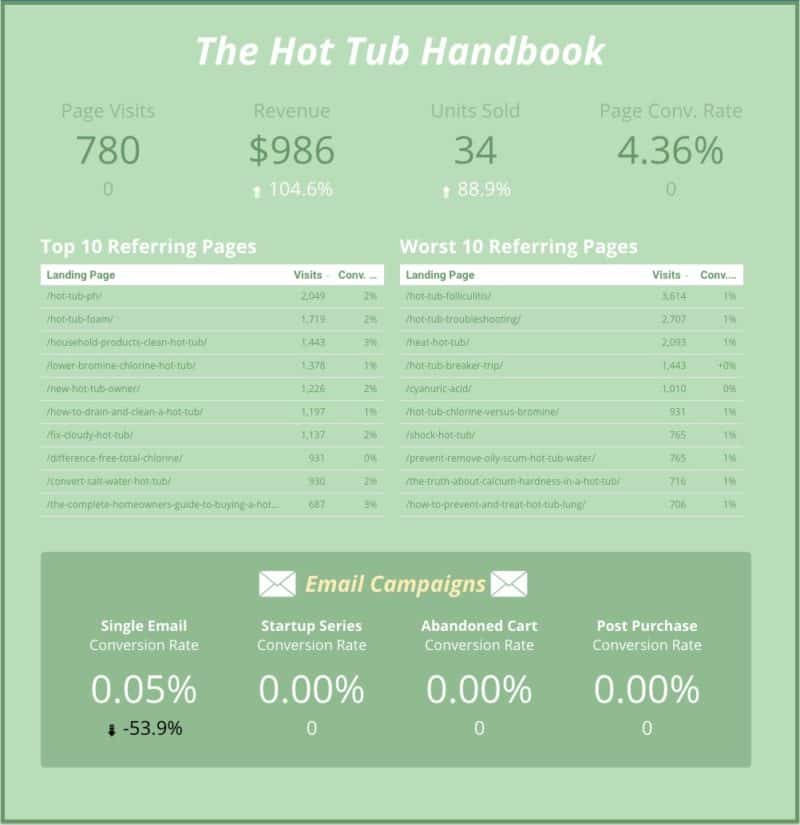
- There are two digital products for sale (PDFs): The Art of Pool Care and The Hot Tub Handbook.
- Both products are priced at $29 each now. For most of 2017, The Hot Tub Handbook as sold for $19, but we came out with an updated edition for $29 in November 2017.
- We sold 675 copies of The Art of Pool Care and 941 copies of The Hot Tub Handbook.
- Each product is promoted on the site and through the email list (roughly 60,000 subscribers) to a sales page.
The Optimization Plan
So how do I plan to double the revenue by just optimizing shit?
1. Gather Data
I need to know a few things in order to know what and how to make improvements.
- What’s the average conversion rate for both product sales pages?
- What pages have low affiliate link click-through rates, but have high traffic?
- What’s my overall traffic-to-subscriber conversion rate?
- How much is an email subscriber actually worth?
- Are the emails I’m sending converting into sales and at what rate?
These are just a few examples. Once, I start finding these out, I’ll have more questions that need to be answered.
I’m going to use Google Analytics to it’s fullest with Google Tag Manager and Google Data Studio to help me organize and display this information.
2. Create a List of Optimization Tasks
Once I know what needs improvement, it should be clear what action I need to take.
For instance, let’s say the conversion rate on the sales page for The Hot Tub Handbook is 5% and I want to try and raise it to 20%. I can A/B test different landing pages to improve that conversion rate.
In this task example, I would do some very simple A/B testing with Google Optimize (another free tool from Google).
I will create a list of tasks in Asana in order of importance/biggest bang for my time.
3. Measure
Once I initiate an optimization task, I’ll measure to make sure the goal was achieved. If not, the task will not be completed. I’ll try another experiment and measure again until the goal has been achieved.
I imagine some tasks will work on the first try and some will take many tries. But as long as I’m measuring, I’ll know what’s working and what’s not.
This will continue for as long as I own the site. However, for this experiment, I’m going to improve things quickly and hope my actions pay off in the short term. That’ll at least know my grand experiment is working and worth it.
1. Gather Data: Setting Up Google Tag Manager, Analytics, and Data Studio
I just learned about Google Tag Manager (GTA). I’m using it to manage all my third-party marketing code snippets, like my Google Analytics tracking code and my Facebook Pixel.
This allows me to manage all my tracking code snippets in one place for all my sites. It’s pretty fucking awesome actually, and I’m mad I just started using it.
Google Tag Manager
I bought this mini video course to help me get started. I’m using a free plugin to install the main code called Google Tag Manager for WordPress.
Here are the current tags I have set up in GTA:
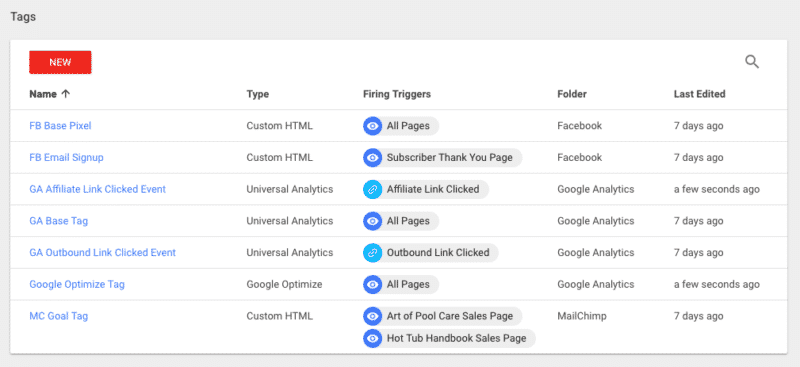
I created custom click triggers to record in Google Analytics (GA) for two actions:
- Record an event in GA whenever an outbound link is clicked and record the URL clicked.
- Record an event GA whenever an Amazon link is clicked.
Both of these triggers were explained in that video course. Super helpful!
You’ll also notice I have tags set up for the Facebook Pixel (and lead conversion for later) and the MailChimp goal tracking tag. This allows me to send abandoned cart emails. More on that later.
Google Analytics
All I did was setup Goals in GA. Here’s all of them:
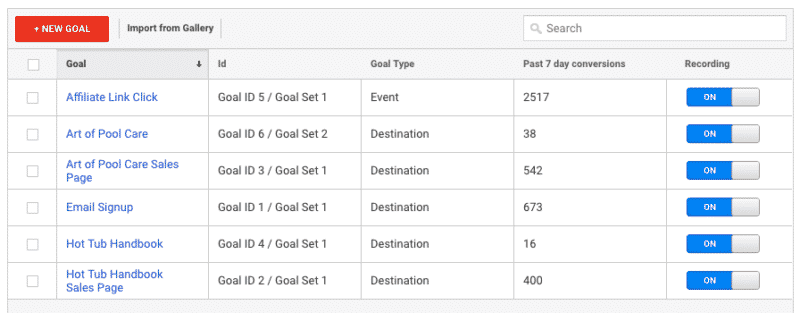
Goals are sweet because I can see completion numbers and conversion rates. Let me break each one down:
- Affiliate Link Click: tracks the custom event whenever an Amazon affiliate link is clicked.
- Art of Pool Care: tracks the number of people who visit the custom Thank You page after they buy the guide.
- Art of Pool Care Sales Page: tracks the number of people who visit the sales page for the guide.
- Email Signup: tracks the number of people who visit the Thank You page after subscribing to the email list.
- Hot Tub Handbook: tracks visits to the custom Thank You page after they buy the guide.
- Hot Tub Handbook Sales Page: tracks the number of people who visit the sales page for the guide.
These are all the goals that I’m tracking on SwimUniversity.com that affect my bottom line. And now that these are set up, I can make them look pretty and useful.
Google Data Studio
The data is being gathered and now I want to display it in a way that looks good. I know if it looks good, I’ll be more likely to look at it more and use it.
Google Data Studio (GDS) allows you to create custom, dynamic pages to display data from GA and other third-party marketing software. But it’s pretty new, so it really only works with Google products.
I did some research and found this video and this site all about setting up a funnel for a content site. It’s run by Drew Birnie and he provides a custom template GDS that outlines a funnel report for a content site. It’s perfect for what I’m doing.
So I took this template and customized it to fit my own data and needs. I also created a few more pages to break down the data even further.
Here’s a super long video of my entire Google Data Studio reports that I built for SwimUniversity.com. This is crazy nerdy, but I’m proud of what I built. If you’re interested in joining me in this experiment with your own site, I think you’re gonna like this:
2. Optimization Tasks: Creating a To-Do List in Asana
I’ve only been gathering this new data for 14 days, but because this site has a lot of traffic, there are tasks that are becoming apparent quickly.
I created an ongoing project in Asana called “Website Development” under the Swim University team. This is where I add all tasks that have to do with improving the code or design of the website.
I have a few goals listed at the top to remind me of what I’m trying to accomplish, the questions I need to answer in order to create optimization tasks, and the tasks themselves.
The First Affiliate Marketing Tasks
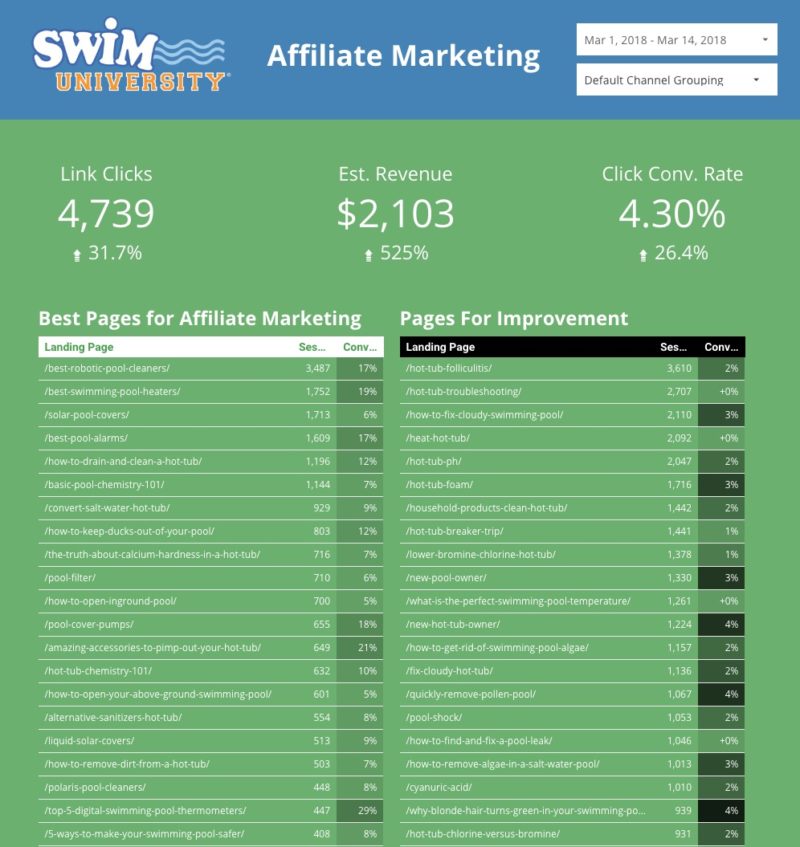
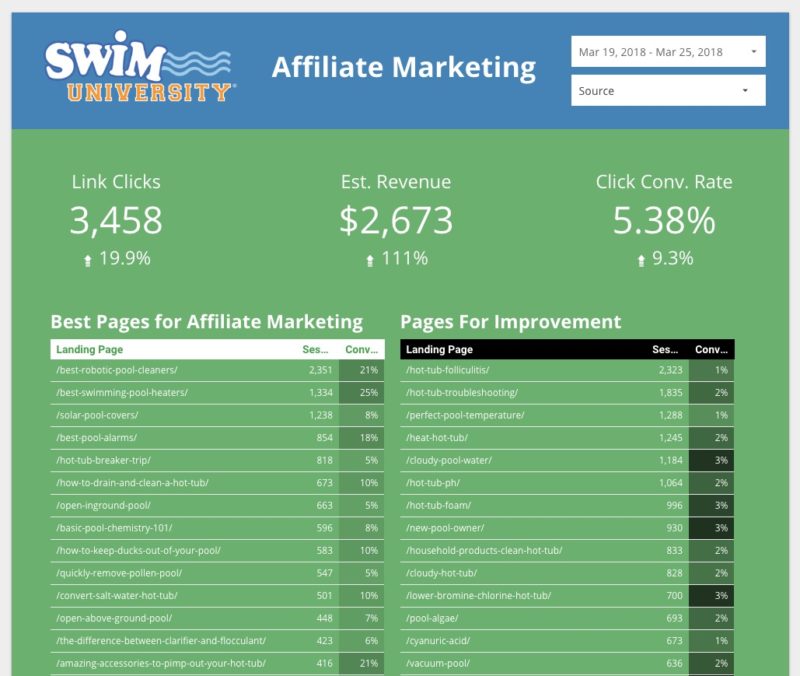
The easiest thing to do right now is to look at my affiliate link data and make improvements on poor-performing pages. Page three of my GDS report highlights those pages that need more affiliate links or better ones.
So, I created a few tasks based on this data to get me started. You’ll notice they all start with “Add 5 Affiliate Links…” That’s just a reminder of what I need to do.
I like to make my tasks as detailed as possible so I don’t have to make decisions on the fly. I can just bury my head in the computer and get shit done.
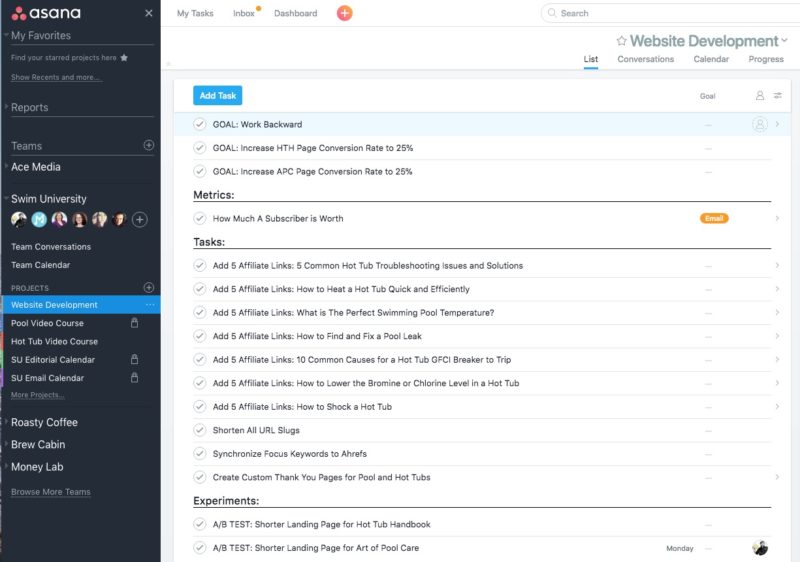
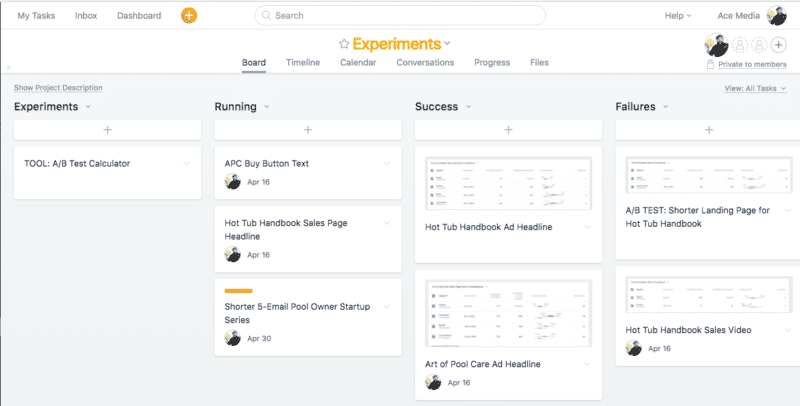
At the bottom, you’ll see a section labeled “Experiments.” These are all my A/B test tasks that I’ll be performing in Google Optimize. I only have two right now. I don’t want to be overwhelmed with ongoing tests and Google only lets me run five at a time anyway.
The First Digital Product Tasks
My goal is to improve the conversion rates of both sales landing pages for my digital guides. I figure, if I can improve this number, I’ll make money right away. And I’m trying to work backward.
The last 14 days of conversion rate data for these pages is on page two of my GDS report.
Once I have a high converting sales page, then I can improve the number of people who visit that page followed by improving the number of people who visit my website.
I’m not sure if this is the best way to do this, but it makes sense to me so far. Things may change as I get into the weeds.
If there are any errors you see or suggestions you have, please email me or tweet me. This is my first attempt at something like this, so any insight would be super helpful 🙂
The First Significant Improvement
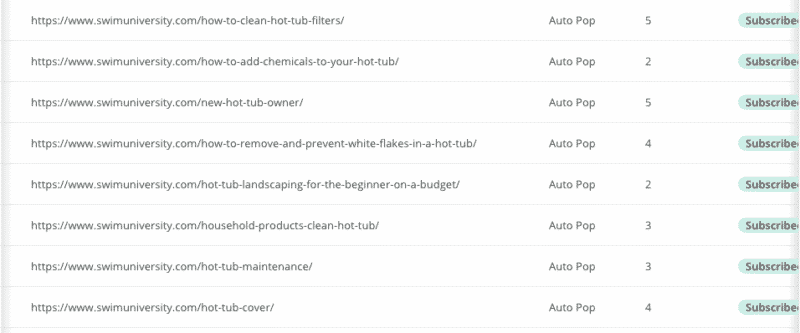
The easiest thing for me to do was add affiliate links to underperforming pages. I created a list of “Pages for Improvement.” It’s a top 20 list sorted by high traffic pages with affiliate link click conversion rates below 5%.
I started with all the pages that showed up at 0%. My Editor In Chief added relevant affiliate links to those posts. And that resulted in a 1% overall affiliate link conversion rate increase across the entire site.
Doesn’t seem like much, but that’s huge. It means we’re getting more clicks to Amazon, which results in more commissions.
And the list keeps changing, giving us even more to optimize.
For instance, if a page has a 0% conversion rate and we add links that increase it to over 5%, it disappears off the list and makes room for more lower-performing pages we need to focus on.
This is a shot of the last 7 days and you can see the increases versus the pervious 7-day period:
The First A/B Test
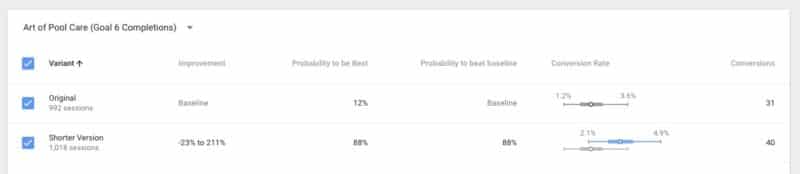
I’m working backward to improve the sales pages of my digital products first before trying to optimize more traffic to them. I ran an A/B on my pool care ebook to see if a shorter landing page would result in more sales.
In copywriting, they say that fewer words are needed to sell lower priced items. Since my ebook is only $29, I wanted to test this out.
I’ve been running this test for the last 23 days, and I’m pretty sure the shorter landing page is the winner. Google says to either let a test run for two weeks or when the “probability to beat the baseline is 95%.” Neither is true for this test, but it’s close.
The shorter landing page increases the overall conversion rate by 1%. While not significant, I’ll take it.
Email Funnel Testing
I’m running one more test. I created a new and shorter email automation for new subscribers who are pool owners.
It’s a 5-part email series that sells my ebook at the end. I took the entire series outline from this blog post. So far, I’ve sold one ebook because of it, which is great because people haven’t even been through the whole cycle yet.
I don’t have enough data to say that this funnel is better than my previous one, but I have high hopes.
If it doesn’t perform how I want it to, I’ll attempt another funnel sequence.
This is not a true A/B test. I paused my original funnel and created a new one instead. So this will need a few weeks of testing until I have enough data to know one way or the other.
One this is for sure, my open and click rates are better already. So that’s promising.
Hacking MailChimp For A/B Testing Automations
I wanna make more money with my email list. But I want it on autopilot.
For years, I had a 10-email automation setup for new subscribers. I originally got the 10-email framework from Nathan Barry’s post. I think I started it back in 2014 and haven’t updated it since. I didn’t even know how well it was converting.
I found out recently and it sucked.
So I wanted to A/B test different automations for new subscribers to see if I could increase my sales conversions. But like a motherfucker, MailChimp doesn’t offer that.
However, MailChimp lets a hacky programmer internet nerd like me find a way around it. So it’s possible, but you gotta know how to code a bit. But not much.
I learned how to do it from this post on MeedEdgar.com. They didn’t explain the code part, but I figured it out. And here’s what I did to setup A/B testing automations on MailChimp:
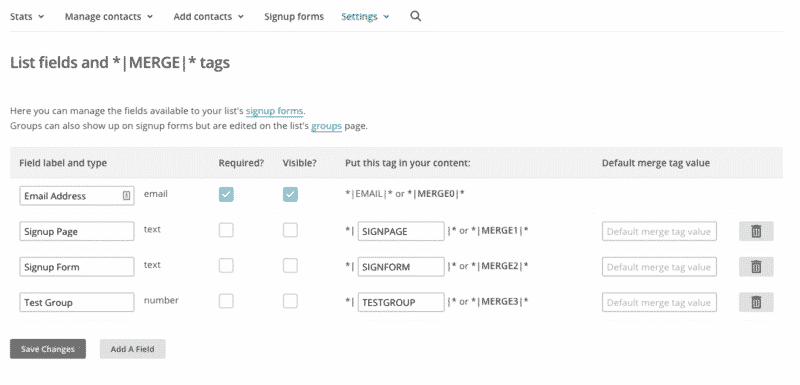
1. Create a Custom List Field to Store a Number
Under the Settings menu in your list, you can add custom fields. I have three:
- Signup Page: Stores the full URL of the page the subscriber signed up on.
- Signup Form: Which type of form the used to subscribe (i.e. popup, in-post, bottom of post, clicked byline, resource page, etc.)
- Test Group: Assigns a number from 1 to 6 to every new subscriber.
2. Code a Random Number Into a Hidden Form Field
I used a simple PHP snippet to randomly generate a number from 1 to 6 and added it to a hidden form field. Because I code my own forms using the MailChimp API, this was easy.

The echo(rand(1,6)) code snippet is what I’m talking about. This addes a number into the testgroup form field that gets added to MailChimp when a visitor subscribes.
NOTE: The image above is an edited shot of my MailChimp list for Swim University. It shows the Signup Page, Signup Form, And Test Group Number.
3. Create Two Brand New Automations to Test
Now I can use these random numbers to segment who goes to each automation. Since I’ve been running the same automation for years, I had to duplicate it and start the stats over from scratch to get accurate reporting.
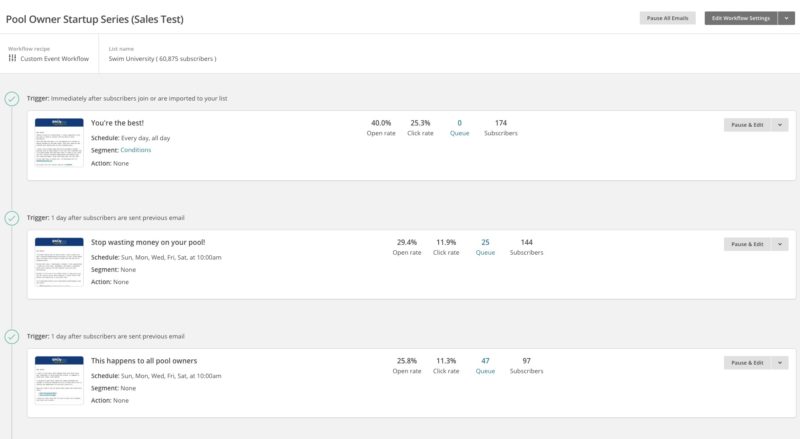
Then, I created a new automation to test against. In the new one, I’m testing to see if I can shorten the email series to 5 emails and send it out 5 days in a row instead of over the course of 30 days like the original.
This is a drastic A/B test, but if it works…I’ll kiss my computer in public. With tongue.
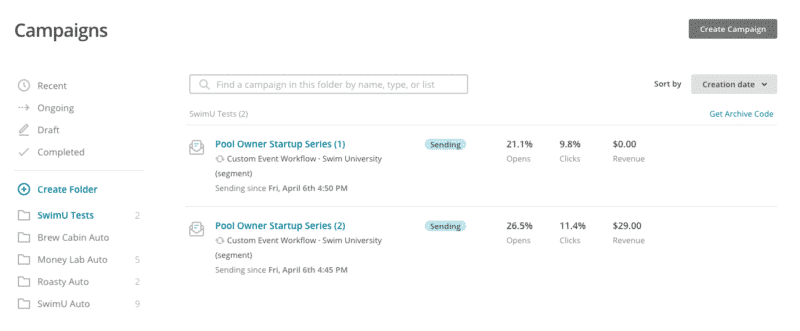
Pool Owner Startup Series (1) is the original 10-email automation over 30 days. The Pool Owner Startup Series (2) is only 5-emails over 5-days. Each automation has the same sales pitch email for my digital pool ebook.
So far from this image, you can see that the shorter one is working much better. And I’m very happy about that.
In order to split the subscribers into these two automations, I created a condition on the first email of each automation.
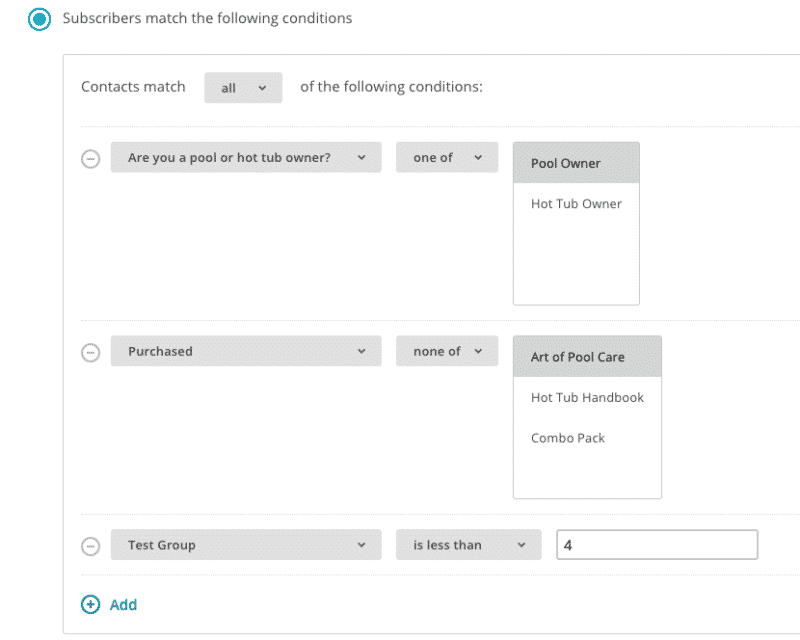
First, I make sure they’re a pool owner (I automatically put pool owners in a group if they signup on a page about pool care). Then, I make sure they haven’t purchased the guide yet. And finally, if their Test Group number is less than 4 (1 to 3), then send them through this automation.
For the second test automation, of course, I say the Test Group should be greater than 3 (4 to 6).
Also, I start them at the same time and wait for it to complete so I have enough data to make a decision which is the better automation.
4. Measure and Determine a Winner
Obviously, I’m not at this stage yet. But I’m looking to see what automation has a better overall open rate and more sales. Pretty easy.
Once I figure this out, then I’ll start testing against the winner, changing only one variable at a time. Hopefully, the shorter one wins so these tests are quicker!
It’s pretty hacky, but it works. And I have good control over it.
I’m keeping track of all these A/B tests from MailChimp and Google Optimize in an Asana board.
I’ll be honest, this shit is boring. And as a person who likes to be creative and make stuff, this fucking blows.
On the bright side, it’s helping me make more money. And I finally know what it’s like to run a business like an adult. A boring, old, cranky adult.
My goal is to turn this into a system that someone else can manage so I can go back to making silly rap albums about this 🙂
Wrapping Things Up For Now (The Results)
It’s been two months since I started this experiment and I have good news to report: I increased my revenue. However, I didn’t double it. I knew that was a stretch.
What Was The Traffic?
We’re going to look at the month of April 2018. First, let’s see how much traffic we got compared to last year. The goal was to make more money without increasing traffic. But SwimUniversity.com grows every year, so we have to take into account the natural increase.
NOTE: To be clear, I’m writing this on the last day of April, so I will only compare April 1st to the 29th.
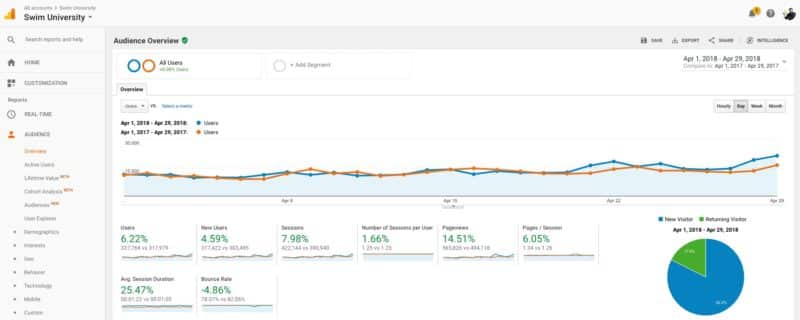
I gained 6.22% more traffic from 2017. Which is 337,768 vs 317,979 users. That’s not a big increase. But what’s cool is this is still growing after doing a huge content audit where I deleted three of my top performing posts!
Did Affiliate Revenue Increase?
Now let’s look at my affiliate revenue compared to last year. From my Google Data Studio chart, I can see that we increased our affiliate link click conversions from the previous 29 days. That means more people clicked affiliate links!
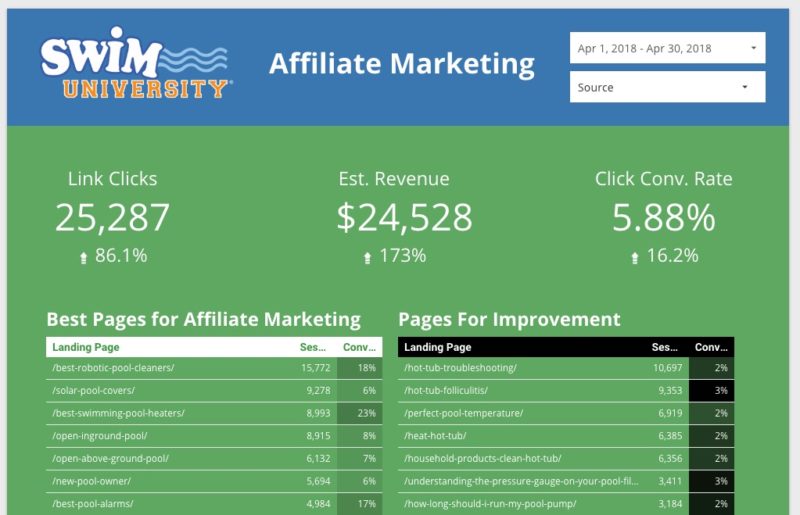
I don’t have conversion rate and link click numbers from 2017, but I have revenue. So let’s compare:
- April (1st to 29th) 2017 Affiliate Revenue: $14,337.28
- April (1st to 29th) 2018 Affiliate Revenue: $19,870.53
- Revenue Increase: $5,533.25 (+38.59%)
Not too bad from just adding more affiliate links to the site and a 6% traffic increase. But again, not double.
Did Digital Product Revenue Increase?
This is where I did most of the work. I’ve been running A/B tests trying to increase both sales page conversion rates for my products. But I wasn’t able to.
However, I was able to increase the number of people who visited those sales pages by adding more internal ads to my site to those products and creating a better email automation series for new subscribers.
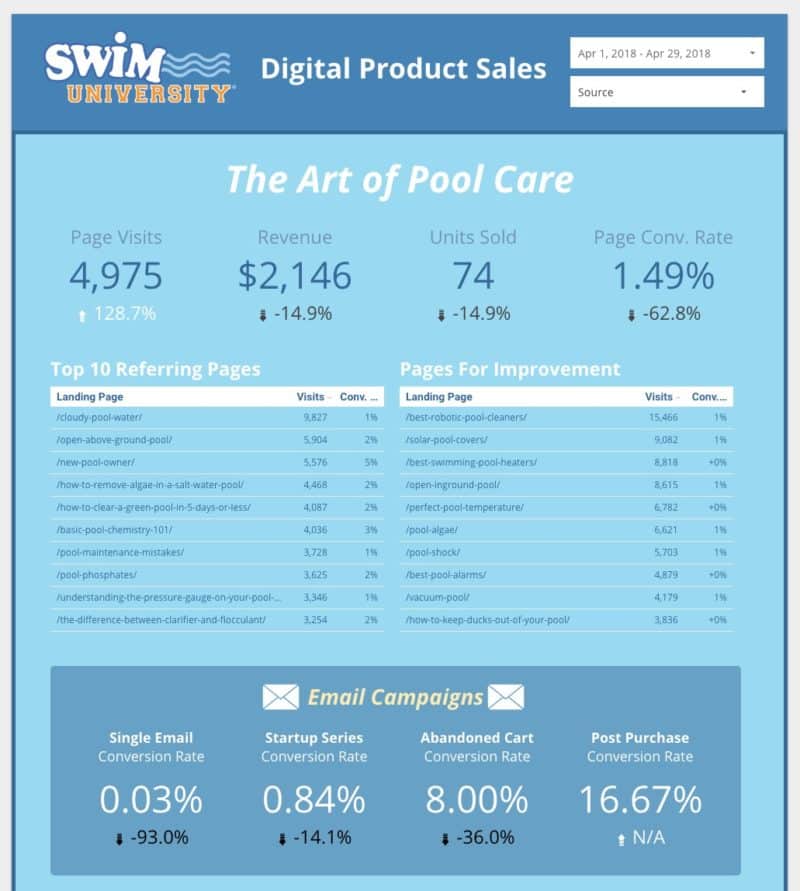
If we just look at The Art of Pool Care digital product stats, we can see that I was able to increase visits to the page. However, the reason all the numbers are negative is that I’m comparing the data to March 2018 where I ran a huge sale for this product. That really skewed the results.
The real test is comparing total revenue from last year.
- April 2017 Affiliate Revenue: $3,071.00
- April 2018 Affiliate Revenue: $4,696.00
- Revenue Increase: $1,625 (+52.91%)
Again, not double, but better.
That means I was able to increase my revenue by $7,158.25 with only a 6% increase in overall traffic. To me, that’s pretty damn good just doing a couple of minor tweaks to my site.
What’s Next?
Over time, I will continue to gather data and test new tweaks in order to increase my conversion rates. I’m sure I can do better. But at the same time, my team and I will work on increasing traffic, which will naturally increase revenue.
Here’s What Worked
- Adding affiliate links to high performing pages.
- Creating a shorter email automation for new subscribers with an effort for them to buy my digital products.
- Adding ads at the top of high traffic posts to my digital products.
- A/B testing sales page headlines and making sure the sales page headlines matched the ad headlines on the site.
What Didn’t Work
- Adding a sales videos to the sales pages.
- Adding trust symbols under the buy buttons.
- Creating shorter sales pages with only one call to action.
I did learn that this stuff is fucking boring, and the payoff isn’t blowing my socks off. Was it worth it? Yes. But this type of work is just not for me.
However, I would happily pay someone to do this because it clearly has a benefit.